
Stocks gained some steam early in the session when the ISM (Institute for Supply Management) survey showed factory activity expanded in June, but gave it back quickly as oil prices jumped on the Middle East news. The Pentagon released a statement mid-day dismissing the news and oil prices pulled back; stocks gained ground as crude fell from the session’s highs.
(With all of this talk of a strike, and Israel’s military exercise last month preparing for what may be the inevitable, Iran is suddenly inviting the idea of talks over their nuclear activities. Of course, this is what Iran does; they act as though they are serious about keeping to their end of the bargain, while they buy time and continue to enrich uranium to weapons grade status. The Israeli’s understand this and prudently prepare for action considering the regime continues to makes statement such as “Israel will be wiped from the map.” The market is currently trying to assess the appropriate multiple due to this uncertainty, among others.)
Market Activity for July 1, 2008
 The S&P 500, as the chart below illustrates, had been down as much as 1.5% from the opening price, but jumped nearly 2% from those lows to close the session meaningfully higher. Financial, consumer discretionary and energy shares led the broad-market’s advance. The Dow’s gain was propelled by shares of American Express, Proctor and Gamble, McDonalds and Wal-Mart.
 Advancing stocks just about matched decliners on the NSYE. Some 1.58 billion shares traded on the Big Board, slightly more than the three-month daily average. For this July 4th holiday-shortened week, volume is usually much lower, but with the June jobs data release coming on Thursday, traders likely delayed vacation to be around for this all-important report.
On the economic front, the latest manufacturing report showed factory activity expanded in June, marking the first move above 50 (the level that divides expansion and contraction) since January. Even so, during the previous four months of contraction, the index was just barely below the line of expansion and no where near the level that indicates trouble.
The Chairman of the Institute for Supply Management explained in the report, as we’ve touched on in the past, that when the survey averages 50 it corresponds to roughly 2.8% real annualized GDP growth. During the second quarter ISM averaged 49.4, so we’re looking at a GDP reading of about 2.6% by this indication.
(I believe we will see a number in that range as increased capital goods shipments, higher personal consumption numbers and the production needed to rebuild low inventory levels will catalyze growth. Housing will continue to subtract a full percentage point from the reading; if housing were merely flat, GDP would come in at 3.5% for Q2, but this flattening will not take place until the supply of homes comes down significantly – which will probably take another year, hopefully.)
 In a separate report, the Commerce Department reported that construction spending fell less-than-expected in May, declining by 0.4% -- the consensus estimate was for a 0.6% decline. The April reading was revised higher to show a 0.1% drop, after previously estimated at a 0.4% decline.
Two months of declines surely doesn’t give one a sense of full-flowing optimism, but considering the residential component – which makes up 40% of this reading – was down 1.6% in May (and off by 26.9% year-over-year) these mild declines are relatively good news. Strength came from lodging construction (up 2.6% for the month), schools (up 1.6%), power plants (up 1.5%) and manufacturing facilities (up 0.9%).
Lastly, the auto industry released its sales data for June, and the turn down of the past three months continues. But lower sales volumes are not the result of a lack of credit availability or even demand. Instead, according to the report, there is just too much supply of trucks and SUVS and not enough of what consumers currently desire during this period of high fuel prices – more fuel efficient vehicles.
Over the next several months manufacturers will undoubtedly ramp up production of the cars people want in this environment and unless something changes with regard to the job market – which is currently soft but not showing statistically significant declines – sales should rebound several months out.

Have a great day!
Brent Vondera, Senior Analyst


 The financial sector, to no one’s surprise, led the broad market lower for the quarter as the index that tracks these shares tumbled 19.01%. The next worst performer was the industrial group. Six of the 10 major industry groups declined during the prior three months.


 Today marks the final day of the third quarter and things aren’t looking real nice as the broad market is set to decline 3.4% for the past three months. The poor quarterly results are due to the worst June performance since 1930 – down 8% this month with the final session to go. We were off to such a good quarter too as April was up 4.75% and May add another 1.07%. But oil prices have proven to be too much for the market to handle. Sure, we have a soft labor market and the questions as to the duration of the housing correction, but let’s face it the job-market declines have been mild and housing has been baked in for a while. It’s mostly about the direction of energy prices at this point.

 For what it’s worth, the U.S. indices are holding up better than most markets. Year-to-date, Germany is down 14.12%; France is off by 15.57; Britain is down 14%; Spain has declined 14.10% -- and that’s with currency adjustment. In addition, Hong Kong is down 20.7%; China’s major index has plunged 45%; India is off by 32%.
 On the economic front, the data wasn’t too bad really, actually quite good regarding the GDP when considering all of the recession predictions.

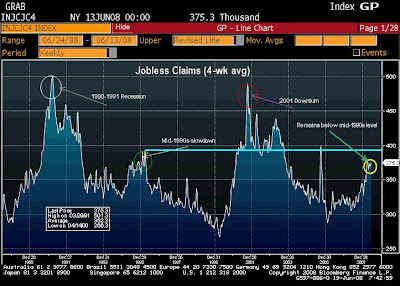
 Lastly, the Labor Department reported that initial jobless claims came in flat from the previous week’s reading. For the week ended June 21 claims remained at 384,000, which is a bit higher than we would like. In the currently soft job market environment, we’d like to see claims hovering around 365,000-375,000 – this level would give us confidence that the monthly job losses would remain very tame. The current level of claims is not terrible, so long as we remain below 400,000 it is unlikely we’ll see a sharp monthly decline in payroll jobs, but still a small decline from here would make me more comfortable especially regarding the outlook for income growth.
 This morning we get the May figures for personal income and spending, along with the inflation gauge tied to it all.
 During the morning session, stocks shook off another very weak new home sales number – this time for May – as a pretty good durable goods report helped investor optimism. That report showed orders were flat for May, but electronics, computer products and telecommunication equipment showed nice gains and shipments of capital goods, which flows directly to the GDP figure, gave good indication second-quarter growth will be stronger than expected. More on this later.
 Crude oil futures fell roughly 4% as the weekly energy report showed supplies rose 803,000 barrels – the forecast was for a decline of 1.1 million barrels. Fuel demand averaged 20.2 million barrels per day during the past four weeks, down 2.3% from a year earlier. Crude recovered half of this decline after the Fed’s comments showed they still don’t get it, which we’ll also get to below.
 In a separate report, the Commerce Department reported that May durable goods orders came in flat. What kept the figure flat from the April reading was a big drop in machinery orders, down 5.3%. Strong orders in April and March – up 5.1% and 8.5%, respectively – caused the machinery orders respite. Vehicles and parts also weighed on the figure, which as been a reality for several months now. Those orders were down 3.5% and many auto plants remain idle.
 Overall, the FOMC release was a big let down and we’ll likely have to deal with a dollar that struggles to gain ground and thus oil prices that remain above $100 per barrel, possibly above this $130 mark as the Fed is directing short-term traders to stick to the commodity trade.


 Seven of the 10 major industry groups closed lower yesterday – financials, consumer staples and telecoms were the three that ended on the plus side.


 And speaking of higher costs, we’re seeing trends continue to point to a situation that the Fed may lose control of if they don’t take their heads out of their Keynesian textbooks and focus more on market realities.
 Meanwhile, the Fed fiddles. The irony is that a mild boost in the fed funds rate (the Fed’s benchmark rate) can actually fuel growth by lowering transportation costs via lower fuel prices. That’s opposite the conventional wisdom (higher rates boosting economic activity) but watch it work…if the Fed would only get to it.
 In the meantime, it will prove beneficial to stick to the allocation that best meets your risk tolerance and goals. One never knows when the rally – a sustained rally -- will come, but it generally arrives when least expected. Again, pro-growth polices are key, and I believe this is the road the U.S. will choose, outside of our typical swerves off of the prosperity-producing path on occasion. We have not swerved just yet, but the uncertainty of such action is one concern that has investors a bit wary.
 Finally, the Philly Fed index – a gauge of factory activity compiled by the Philadelphia Federal Reserve Bank – showed that manufacturing activity continues to weaken. Most regions in fact have shown weaker factory activity over the past few months, but the Philadelphia region has been particularly hard hit as it is more dependent on the housing sector than any other.
 Inventories are simply too elevated and until we get the sales figures to kick up, we’re not going to see the inventory-to-sales figure come much lower. As the graph below depicts, new home inventory stands at 10.6 months’ worth of supply. We need this number to come down to 6 months’ worth before housing begins to add to growth once again. My feel is that housing will flatten out by the second quarter of 2009 and will add slightly to growth by the end of 2009.
 In a separate report, Commerce also stated industrial production declined for a second-straight month, falling 0.2% in May. The April decline was 0.7% and the trend is not good. It’s important that we see some rebound for June because we do not want one of these sub-zero gaps to occur – illustrated by the chart --, that would spell trouble.
 Lastly, the Labor Department showed that producer prices jumped 1.4% in May and 7.2% from the year-ago period. This was mostly driven by higher energy prices as the ex-energy reading rose by a much lighter 0.4% in May and is up little more than half as much in terms of the overall reading from the year-ago period.
 Of the 10 major S&P 500 industry groups, financials were the best-performing area, adding 1.05%. Energy and information technology shares also gained some ground, while consumer staple and health-care shares led the laggards lower. By the close, six of the 10 ended in the red.
 I think the view regarding some tightening will increase again this morning after the producer price index for May is releases at 7:30CDT. This number is trending 6-7% year-over-year and unless it returns to the 4-5% range, the Fed will feel pressure to do something – at least I hope they will for the dollar’s sake and the price of oil.
 This weekend we also saw that Saudi Arabia has chosen to boost production by 550,000 barrels per day beginning next month. This will bring their daily production to roughly 10 million barrels. It appears that Bush trip a couple of weeks back actually was effective – it was reported at the time that he went hat-in-hand to the Saudi’s and came back with nothing. I don’t think it is a coincidence that they are suddenly announcing a boost to production as the President likely reminded the Saudi Family it is the U.S. that stands between them and an Iranian regime that would love to invade as Mideast hegemony is their primary goal.
 As the whole point of this morning’s commentary suggests, higher energy prices were the driver of the CPI report. The energy component jumped 4.4% in May as gas and electricity was up 2.3% and gasoline up 5.7%.