U.S. stocks returned to rally mode after a two-session respite as yesterday morning’s wave of better-than-expected earnings results (on higher cost-cuts, not aggregate demand-driven revenues) offset higher jobless claims and a decline in home prices, as of the latest home-price gauge.
The broad market began the trading day lower and hovered around the flat line for the entire morning session, but rallied in the afternoon. It did fail to make it back to Wednesday’s intra-day high, before the bottom fell out in the final hour of hump day’s session.
The last two days of trading activity have been particularly interesting as a “key reversal” occurred Wednesday -- I don’t put much credence in this stuff, but the broad market did open above the prior day’s close, made a new high, and then retreated to close below the previous day’s low. Then we began Thursday’s session lower, but maybe because a significant pullback never occurred, traders saw this as a sign to push things higher and that was evident during yesterday’s afternoon session.
A sixth-straight month of gain for the LEI index, a gauge of economic prospects six months out, may have helped the market too. However, I’ve got to think that most people understand the gains in this index are completely driven by the Fed’s zero interest-rate policy and bond purchases (a direction that cannot go on for long, unless the economy were to relapse, and thus will have to be reversed). We’ll discuss this below.
Financials, basic material and consumer discretionary shares led the advance. Consumer staples and utility shares were the laggards, but still managed to post gains as all 10 major sectors ended in the black.
Volume was unimpressive as 1.26 billion shares traded on the NYSE Composite – just below the six-month average.
Market Activity for October 22, 2009
 Dollar Rally? Think Again.
The U.S. dollar was rallying a bit yesterday morning, as stock futures were weak – as we’ve talked about, equity market weakness, or a little run for safety, is the only thing the greenback has going for it right now – but reversed course after an interview with Federal Reserve Bank of Boston President Rosengren was aired.
When fielding a question on activity in the dollar, Rosengren stated that the decline was just a result of increased risk taking and is a natural reversal from the greenback’s rally several months ago as we were engaged in full-blown economic and equity market hell. If this view is shared within the central bank in general, which sure seems to be the case, it’s no surprise that the dollar reversed course to end the session lower. The Fed does not believe, or seem to believe, that their zero-interest rate policy and monetization of debt (via quantitative easing) is responsible for the clobbering of the dollar. Now, surely a federal budget situation that is quite the mess is also having an effect on the greenback, but if the Fed isn’t going to acknowledge that flooding the market with dollars is the preponderant element regarding its plunge, then they are in for a rude awakening. And the rest of us may be as well as the aggressive interest rate hikes to rescue the dollar will be needed if they don’t remove their heads from the sand.
Oh, and on the comment that the reversal from the late/2008-early/2009 rally is “natural,” I’ll remind everyone that that rally was from the all-time low for the greenback (as measured by the Dollar Index, which goes back to 1967). We weren’t rallying from some nice level late last year, the dollar was simply temporarily saved from new lows as global investors flood to the U.S. in times of panic due to our deep markets. The fact that the dollar slides again when things appear brighter is not exactly a sign that the world has a great desire to own our currency. What is natural is that the dollar is in decline because of the policy direction.
Jobless Claims
The Labor Department reported that initial jobless claims rose 11,000 last week to 531,000 (515K was expected), halting a two-week decline. Initial claims fell back to 520K in the previous week, still a very elevated level but off of the 550K level that they has been stuck at for a couple of months. The market really needs for initial claims to resume that trend, on its way to sub-500K, in order to offer even a remote indication that some job creation is occurring.
The four-week average held just about steady, coming in at 532,250 after 533,000 in the prior week.

Continuing claims (those drawn for more than one week) fell 98,000 to 5.923 million. This marks the fifth week of decline. However, it is tough to get excited about this move as the vast majority of these people seem to have been moving onto emergency and extended benefit rolls.
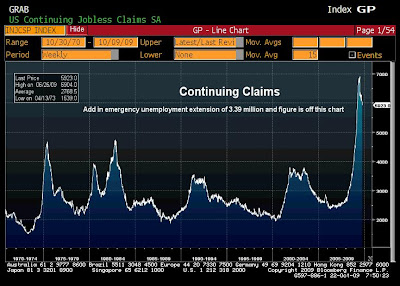 Emergency and extended benefits appear to show the troubles regarding the duration of unemployment persist. First, here’s how it works. When an unemployed recipient of the traditional 26 weeks of unemployment benefits runs out that person can apply for the Emergency Unemployment Compensation (EUC) program, which adds 20 weeks of benefits. When the recipient’s EUC runs out, and still has yet to find (or accept) a job, that person can apply for extended benefits, which offer another 13 weeks of government cash.
What happened last week was that the extended benefits rolls declined by 16,000, but the EUC rolls rose by 40,000. I think the decline in extended rolls was largely due to benefit exhaustion, rather than some form of job creation, which we have yet to see evidence of.

Leading Economic Indicators (LEI)
The Conference Board (a non-profit business organization that has contact to 1600 businesses) reported that its LEI index jumped 1.0% in September, extending the upward trend to six months. The reading is a gauge of economic activity six month out, and from a historical perspective has been a good indicator, but like so many things in this environment one needs to be careful, past indicators may not prove to be as accurate today – I’ll explain below.
 The LEI index has bounced hard off of the depths it hit following the credit crisis that began in earnest with the fall of Lehman Brothers in September 2008 as it has been artificially helped by a Federal Reserve policy that has engaged in a number of things to keep rates very low. (This action by the Fed had kept the index from falling to the levels seen in the 1974 and 1980 recessions, it would have moved below those past depths without a zero-interest rate policy, massive liquidity injections and purchases of Treasury and mortgage-backed bonds. In terms of the bounce, these actions have boosted building permits, stock prices and the money supply, and widened the Treasury curve – all components that have led LEI higher over the past six months. Federal government actions such as clunker cash and the homebuyers’ tax credit have also helped to boost LEI over this period.) But does this mean that LEI is saying we up and away from here? Or is it that this is a head fake due to the short-term nature to which Fed and government actions have boosted things?
To be sure, the economy has improved from very low levels. Components of the index such as consumer expectations, jobless claims and the pace of deliveries have also helped LEI of late, but these improvements are from deep lows more than the normal rebound we see during the early stages of the typical expansion.
The components that boosted LEI for September were the slope of the Treasury yield curve (short-term rates much lower than long-term rates – equals massive bank interest income and something that would usually lead to credit expansion, but not the case this time), consumer expectations and a decline in jobless claims (in September). The yield curve and consumer expectations accounted for more than half of the month’s rise – that is a direct move via what the Fed has done. But it falls apart when the Fed must unwind. Even if that unwind is a ways away, we are just kidding ourselves by thinking the expansion has a shot at longevity.
So these are some things to think about when judging the future path of economic activity via this reading – it may not be quite as accurate as it has been in the past. Basically, one only needs to answer one question. If the federal government, and specifically the central bank, were to pull their crutches, their various policies of short-term support, could the economy stand on its own at this time? If the answer to this question is no, then things are not as good as measures such as LEI make it seem. That’s as simple as it needs to be.
FHFA Home Price Index
The Federal Housing and Finance Agency’s gauge of home prices fell 0.3% in August, after three months of increase. This home-price measure is very broad, much more geographically diverse than CaseShiller, but it does miss the higher-end market as it only captures properties with mortgages backed by Fannie and Freddie.
In terms of region, the West and parts of the Midwest eased the downside as the Pacific (HI, AK, CA and OR) and Mountain (MT, ID, WY, NV, UT, CO, AR, NM) regions recorded price increase with the Midwest essentially flat. The weakness was seen in the South Atlantic (FL, GA and the Carolinas) and New England (ME, NH, VT, MA, RI, CT) regions.
On a year-over year basis, FHFA has home prices down just 3.6% and 10.7% below its April 2007 peak. When we average all major home-price measures, prices are down 10.6% y/o/y.
Britain’s Recession
U.K. GDP unexpectedly declined at a 1.2% annual rate in the third-quarter; the number was released this morning. Economists had expected a 0.8% rise, at an annual rate. Whoops.
Have a great weekend!
Brent Vondera, Senior Analyst
The broad market began the trading day lower and hovered around the flat line for the entire morning session, but rallied in the afternoon. It did fail to make it back to Wednesday’s intra-day high, before the bottom fell out in the final hour of hump day’s session.
The last two days of trading activity have been particularly interesting as a “key reversal” occurred Wednesday -- I don’t put much credence in this stuff, but the broad market did open above the prior day’s close, made a new high, and then retreated to close below the previous day’s low. Then we began Thursday’s session lower, but maybe because a significant pullback never occurred, traders saw this as a sign to push things higher and that was evident during yesterday’s afternoon session.
A sixth-straight month of gain for the LEI index, a gauge of economic prospects six months out, may have helped the market too. However, I’ve got to think that most people understand the gains in this index are completely driven by the Fed’s zero interest-rate policy and bond purchases (a direction that cannot go on for long, unless the economy were to relapse, and thus will have to be reversed). We’ll discuss this below.
Financials, basic material and consumer discretionary shares led the advance. Consumer staples and utility shares were the laggards, but still managed to post gains as all 10 major sectors ended in the black.
Volume was unimpressive as 1.26 billion shares traded on the NYSE Composite – just below the six-month average.
Market Activity for October 22, 2009
Dollar Rally? Think Again.The U.S. dollar was rallying a bit yesterday morning, as stock futures were weak – as we’ve talked about, equity market weakness, or a little run for safety, is the only thing the greenback has going for it right now – but reversed course after an interview with Federal Reserve Bank of Boston President Rosengren was aired.
When fielding a question on activity in the dollar, Rosengren stated that the decline was just a result of increased risk taking and is a natural reversal from the greenback’s rally several months ago as we were engaged in full-blown economic and equity market hell. If this view is shared within the central bank in general, which sure seems to be the case, it’s no surprise that the dollar reversed course to end the session lower. The Fed does not believe, or seem to believe, that their zero-interest rate policy and monetization of debt (via quantitative easing) is responsible for the clobbering of the dollar. Now, surely a federal budget situation that is quite the mess is also having an effect on the greenback, but if the Fed isn’t going to acknowledge that flooding the market with dollars is the preponderant element regarding its plunge, then they are in for a rude awakening. And the rest of us may be as well as the aggressive interest rate hikes to rescue the dollar will be needed if they don’t remove their heads from the sand.
Oh, and on the comment that the reversal from the late/2008-early/2009 rally is “natural,” I’ll remind everyone that that rally was from the all-time low for the greenback (as measured by the Dollar Index, which goes back to 1967). We weren’t rallying from some nice level late last year, the dollar was simply temporarily saved from new lows as global investors flood to the U.S. in times of panic due to our deep markets. The fact that the dollar slides again when things appear brighter is not exactly a sign that the world has a great desire to own our currency. What is natural is that the dollar is in decline because of the policy direction.
Jobless Claims
The Labor Department reported that initial jobless claims rose 11,000 last week to 531,000 (515K was expected), halting a two-week decline. Initial claims fell back to 520K in the previous week, still a very elevated level but off of the 550K level that they has been stuck at for a couple of months. The market really needs for initial claims to resume that trend, on its way to sub-500K, in order to offer even a remote indication that some job creation is occurring.
The four-week average held just about steady, coming in at 532,250 after 533,000 in the prior week.
Continuing claims (those drawn for more than one week) fell 98,000 to 5.923 million. This marks the fifth week of decline. However, it is tough to get excited about this move as the vast majority of these people seem to have been moving onto emergency and extended benefit rolls.
Emergency and extended benefits appear to show the troubles regarding the duration of unemployment persist. First, here’s how it works. When an unemployed recipient of the traditional 26 weeks of unemployment benefits runs out that person can apply for the Emergency Unemployment Compensation (EUC) program, which adds 20 weeks of benefits. When the recipient’s EUC runs out, and still has yet to find (or accept) a job, that person can apply for extended benefits, which offer another 13 weeks of government cash.What happened last week was that the extended benefits rolls declined by 16,000, but the EUC rolls rose by 40,000. I think the decline in extended rolls was largely due to benefit exhaustion, rather than some form of job creation, which we have yet to see evidence of.
Leading Economic Indicators (LEI)
The Conference Board (a non-profit business organization that has contact to 1600 businesses) reported that its LEI index jumped 1.0% in September, extending the upward trend to six months. The reading is a gauge of economic activity six month out, and from a historical perspective has been a good indicator, but like so many things in this environment one needs to be careful, past indicators may not prove to be as accurate today – I’ll explain below.
The LEI index has bounced hard off of the depths it hit following the credit crisis that began in earnest with the fall of Lehman Brothers in September 2008 as it has been artificially helped by a Federal Reserve policy that has engaged in a number of things to keep rates very low. (This action by the Fed had kept the index from falling to the levels seen in the 1974 and 1980 recessions, it would have moved below those past depths without a zero-interest rate policy, massive liquidity injections and purchases of Treasury and mortgage-backed bonds. In terms of the bounce, these actions have boosted building permits, stock prices and the money supply, and widened the Treasury curve – all components that have led LEI higher over the past six months. Federal government actions such as clunker cash and the homebuyers’ tax credit have also helped to boost LEI over this period.) But does this mean that LEI is saying we up and away from here? Or is it that this is a head fake due to the short-term nature to which Fed and government actions have boosted things?To be sure, the economy has improved from very low levels. Components of the index such as consumer expectations, jobless claims and the pace of deliveries have also helped LEI of late, but these improvements are from deep lows more than the normal rebound we see during the early stages of the typical expansion.
The components that boosted LEI for September were the slope of the Treasury yield curve (short-term rates much lower than long-term rates – equals massive bank interest income and something that would usually lead to credit expansion, but not the case this time), consumer expectations and a decline in jobless claims (in September). The yield curve and consumer expectations accounted for more than half of the month’s rise – that is a direct move via what the Fed has done. But it falls apart when the Fed must unwind. Even if that unwind is a ways away, we are just kidding ourselves by thinking the expansion has a shot at longevity.
So these are some things to think about when judging the future path of economic activity via this reading – it may not be quite as accurate as it has been in the past. Basically, one only needs to answer one question. If the federal government, and specifically the central bank, were to pull their crutches, their various policies of short-term support, could the economy stand on its own at this time? If the answer to this question is no, then things are not as good as measures such as LEI make it seem. That’s as simple as it needs to be.
FHFA Home Price Index
The Federal Housing and Finance Agency’s gauge of home prices fell 0.3% in August, after three months of increase. This home-price measure is very broad, much more geographically diverse than CaseShiller, but it does miss the higher-end market as it only captures properties with mortgages backed by Fannie and Freddie.
In terms of region, the West and parts of the Midwest eased the downside as the Pacific (HI, AK, CA and OR) and Mountain (MT, ID, WY, NV, UT, CO, AR, NM) regions recorded price increase with the Midwest essentially flat. The weakness was seen in the South Atlantic (FL, GA and the Carolinas) and New England (ME, NH, VT, MA, RI, CT) regions.
On a year-over year basis, FHFA has home prices down just 3.6% and 10.7% below its April 2007 peak. When we average all major home-price measures, prices are down 10.6% y/o/y.
Britain’s Recession
U.K. GDP unexpectedly declined at a 1.2% annual rate in the third-quarter; the number was released this morning. Economists had expected a 0.8% rise, at an annual rate. Whoops.
Have a great weekend!
Brent Vondera, Senior Analyst
No comments:
Post a Comment