Visit us at our new home!

For new daily content, visit us at our new blog: http://www.acrinv.com/blog/

Friday, September 18, 2009

Afternoon Review: PG, CVX, HPQ

S&P 500: +2.81 (+0.26%)

The S&P closed higher today and finished the week up 1.8%. The S&P 500 has posted weekly gains in eight of the last ten weeks. News flow was slow, but volume and volatility were a bit higher than usual due to quadruple witching options expiration, which occurs once every three months. Quadruple witching is when futures and options contracts on indexes and individual stocks all expire at the close of trading.

Defensive sectors led the market higher, with Telecom and Consumer Staples at the top of the pack. Procter & Gamble (PG) gained 3.22% as Citigroup lifted their rating on the world’s largest consumer goods company. Last Friday, PG reaffirmed earnings and said they expected to resume organic sales growth as they lower prices to take back market share from discount consumer goods.

Chevron (CVX) was one of the few gainers in the Energy sector thanks to a Credit Suisse upgrade suggesting that Chevron “looks best equipped of the Majors to deliver growth over the cycle.”

Hewlett-Packard (HPQ) rose 0.96% after Stifel Nicolaus recommended buying shares citing the positive PC and enterprise server/storage demand environment.


Quick Hits

--

Peter Lazaroff, Investment Analyst

Fixed Income Recap


Treasuries were lower across all maturities yesterday highlighted by the announcement of $112 billion in note issuance next week. The curve flattened 3.7 basis points to finish the day at +244.6 bps – 10-year TIPS breakevens tightened to 1.83% but still remain in the top half of the recent range.

Indirect bids, which include foreign central banks, have been propping up these auctions as of late, which can be seen as a positive… as long as it stays. It has become the trend for bonds to selloff pretty heavy on the supply announcements, only to rebound on strong demand after yields are juiced by the prior week’s price action.

There is no economic data this morning but The Federal Open Market Committee will meet next week and release their decision on the Fed Funds Target Rate on Wednesday, along with the Committee’s statement from the meeting. I mentioned a few days ago the there is some speculation that more than one voting member will push for a hike in the target rate this go around. The market isn’t assigning much worth these rumors either – the futures market that assigns probabilities to different Fed decisions is pricing a 100% chance the committee leaves the rate unchanged. The same market has a 5% chance of a hike to .5% by the next meeting in November. Next week’s meeting will also be the last time the Fed has a chance to comment on the finale of the Treasury and MBS purchasing campaigns. I don’t expect much excitement on this front, but you never know.

Cliff J. Reynolds Jr., Investment Analyst

Daily Insight

U.S. stocks fell for the first day in four as the Fed’s latest flow of funds report reminded the market that debt levels remain high. This offset a jump in the Philly Fed index and a decline in initial jobless claims. The pullback was slight though, especially considering the run we’ve seen; it was more like a pause than anything else.

Nine of the 10 major industry groups closed lower; health-care was the only one to escape downside, the index that tracks these shares closed unchanged for the day. Telecom, energy and utility shares were the worst performers on the session.

The Fed’s flow of funds data for the second quarter did show that household net worth rebounded by $2 trillion ($323 billion from home prices and $1.6 trillion from the rise in stocks) to $53.1 trillion. But the report also showed that household debt (mortgages and consumer credit) remained high at 118% of disposable income. This is down from 120% in Q1, but up from 100% in 2001 and 90% a decade back.

To be sure, even the day’s more positive data had elements that indicated things remain quite subdued. The Philly Fed index, while up nicely, showed its employment and inventory gauges deteriorated. The jobless claims data, while showing initial claims decreased, reported that continuing claims jumped.

We’ve had three straight sessions now in which volume has returned to more normal levels, averaging 1.48 billion shares – that’s in line with the five-year average.

Market Activity for September 17, 2009
Jobless Claims


The Labor Department reported that initial jobless claims fell 12,000 to 545,000 for the week ended September 12 from an upwardly revised 557,000 in the week prior. The four-week average of initial claims fell 8,750 to 563,000. This is the lowest level since…well, it wasn’t that long ago – the week of August 21.

This data coincides with the survey period for the September monthly jobs report, so the reduction of 35,000 in initial claims from this time last month may signal a slower rate of payroll decline when the employment report is released – we’ll get that figure on October 2. That said, the Labor Department did mention that last week’s decline may have been influenced (to the downside) by the Labor Day holiday. We should learn the affect the holiday had, if any, by next week’s release.

Continuing claims jumped 129,000 to bring the figure back above the 6.2 million level; this erases what many saw as repair over the past month. It’s likely the decline of the previous couple of weeks was more a function of benefits expiring than some sort of job creation taking place. As we’ve touched on for a few weeks now, the duration of unemployment and the exhaustion rate of benefits – the former just barely off of the record high and the latter still making new highs – is the common sense reason for the dip in claims we had seen of late.

The Emergency Unemployment Compensation component rose 21,781 to a new level of 3.141 million. This number involves people who have seen their benefits expire but have yet to find a job – most states offer this emergency extension.


Housing Starts

Housing starts, as measured by the Commerce Department, rose 1.5% in August, after slipping 0.2% in July – starts rose at a seasonally-adjusted annual rate of 598,000, perfectly in line with expectations. This reading for August is the highest print since November when starts came in at 655,000.

The headline number made the report appear a bit better than was actually the case; starts were driven by multi-family housing starts, which jumped 25.3% in August. This is a very volatile component of the overall figure and thus it makes it difficult to have conviction starts will continue to rise and continue to benefit GDP. (The rise we’ve seen in housing starts, even though they are off of all-time record lows, will add to Q3 GDP after subtracting from the figure for 12 straight quarters.)

The single-family side of this data saw starts fall 3.0%, marking the first decline since hitting its record low in January. Single-family permits also slipped in August, although a slight 0.2%. Even though this decline isn’t meaningful, it does suggest we’ll see single-fam. starts fall in September. People should be fine with this as the supply figures still need to come lower. If we get too far ahead of ourselves, all we’re doing is delaying a true recovery as construction will only have to retrenchment if sales fail to keep improving.

And speaking of home sales and construction, the chairman of the National Association of Home Builders stated (referring to the homebuyers tax credit), the “window is now basically closed for being able to start a new home that can be completed in time for buyers to take advantage of the tax credit before it expires at the end of November.” So builders are certainly concerned about the expiry of that credit (just another crutch for the industry). He also stated, “Congress needs to act now to keep the credit from expiring just as the intended effect on buyer demand is starting to materialize. And they are doing so as we speak, it appears we’ll get a six month extension.

Philly Fed

The Federal Reserve Bank of Philadelphia’s business outlook survey, known as the Philly Fed, jumped to 14.1 from 4.2% in August – this marks the highest reading since June 2007. The sub-indices of the survey were mixed, however.

New orders remained positive (in expansion mode) coming in at 3.3 for September, but this is down from the 4.2 print in August. The shipments index rose to 8.2 from 0.6. The average workweek improved to -3.9 from -6.3, but of course, as the negative sign implies, remains in contraction mode.

On the components of the report that showed deterioration, delivery times fell to -8.9 from -7.0 (a positive reading means delivery times have slowed and thus suppliers are having a tough time keeping up with orders, which obviously wasn’t the case last month as it fell further into negative territory). The inventories survey got crushed, falling 17.8 points to -18.1. We saw this with the Empire Manufacturing reading too; we are not seeing stockpiles being refilled, in fact both Philly and Empire showed inventory levels became even leaner. (This does suggest the inventory dynamic will be powerful for fourth-quarter GDP, but without an upswing in final demand it will be a one-and-done event). And then we have the employment index, which deteriorated, printing -14.3 from -12.9 in August.

Another interesting aspect of the report was the divergence in the price paid index vs. prices received. Prices paid jumped to 14.9 from 10.0, yet prices received got hammered, falling to -10.6 from -1.5. This does not speak well of profit margins, just as the Empire data suggested.


Have a great weekend!


Brent Vondera, Senior Analyst

Thursday, September 17, 2009

Comparing commodity exposure strategies

As the dollar gets beaten into the ground, you may be tempted to chase the gold trade. Commodities are in line to have a good year based on a weaker dollar, a rebound in Asia, global procurement policies, and the spreading tide of trade protectionism. In addition, the massive stimulus and fiscal policy implemented throughout the world has raised legitimate inflation concerns. It is these reasons that investors are piling into hard assets like gold.

Acropolis, however, does not invest directly in commodities because they do not offer the optimal risk/return relationship when compared to other inflation hedges like Treasury Inflation Protected Securities (TIPS). The table below compares the average annual return and the standard deviation (also referred to as variance or volatility) of gold, the CRB Commodity Price Index, and TIPS.


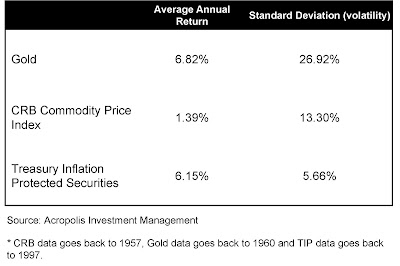
As you can see, gold has the highest average annual return but is by far the most volatile, with returns varying by 26.92%. Meanwhile, TIPS have a slightly lower average annual return but are much less volatile, with returns varying only 5.66%. The CRB Commodity Price Index, a widely used aggregate of all commodities, has the lowest return but is still more than two times as volatile as TIPS. As a result, we view TIPS as a superior inflation hedge to commodities.

Unlike other Treasury securities, TIPS’ coupon payments and underlying principal are automatically increased to compensate for inflation as measured by the consumer price index (CPI).

TIPS have a smaller track record – TIPS data only goes back to 1997 while commodities data stretches back to 1957 – so the comparison above is a bit unfair. Still, you would be hard pressed to find an investment with a guarantee by the U.S. government on the growth of your purchasing power.

In addition to TIPS, Acropolis believes owning commodity-related stocks that provide earnings and dividend streams is a more reasonable inflation hedge than owning hard assets like gold, especially with our long-term mindset.

Companies such as Chevron (Chevron), Transocean (RIG), or Arch Coal (ACI) are obviously commodity-related stocks, but you shouldn’t forget those who benefit through increased demand for mining commodities such as equipment makers Caterpillar (CAT) and Harsco (HSC) as well as industrial container manufacturers like Greif (GEF). Of course there are also transportation companies like Norfolk Southern (NSC) and Expeditors International of Washington (EXPD) that would see increased revenues in light of higher commodity prices. The list could go on and on.

Acropolis also gets commodity exposure through investments in the Asia-Pacific and Australian regions, where commodities are a key driver of economies. Even more, the commodity exposure of Emerging Markets is more than double that of the S&P 500.

--


Peter J. Lazaroff, Investment Analyst

Quick Hits

Fixed Income Recap


The belly of the curve sold off while bills and the long bond finished higher for the day. The curve flattened three and a half basis points to +248 bps., and ten-year TIPS breakevens tightened 3 bps to 159 bps. despite the better than expected CPI figures.

Just a few days after making new lows, the TED spread jumped 3 basis points yesterday thanks to the unwinding of a little known Fed program. The Fed’s Supplementary Financing Program has involved the Treasury maintaining $200 billion in additional bills outstanding and shipping the money over to the Fed for their balance sheet operations – instead of the Fed printing the money on their own. It was announced yesterday that this will be unwound to $15 billion in the coming weeks, presenting a supply issue that bills rallied on. There was also a report out that two FOMC voters will favor a rate hike at next week’s meeting, but I’m not giving much credence to that talk at this point. At least not while the majority of FOMC members are still telegraphing, “Exceptionally low levels of the federal funds rate for an extended period.”


Cliff J. Reynolds Jr., Investment Analyst

Daily Insight

U.S. stocks ran hard again as investor demand kept the good times rolling and the S&P 500 has now covered 400 points from its lowly level of 666 hit on March 9. Yesterday’s industrial production (IP) reading provided the impetus to push stocks higher for the eighth day in nine. That IP reading came in better than expected and marked the second straight gain after 17 of the last 18 arduous months saw the measure contract at the deepest rate since WWII.

Investors now believe the global economy has returned to growth. Yours truly thinks otherwise, as most everyone knows by now. There is no doubt we’ll see GDP print its first positive reading in a year, as we’ve been explaining for more than two months now, but the sustainability of this recovery is very much in question – those who believe this will exhibit a normal business cycle expansion should be very careful. It is important to understand that a number of areas are being propped up right now, massive government spending will crowd out private sector activity (the degree of this crowding cannot be known) and history shows that the vast majority of government “fixes” (and they’ll be “fixing” a lot) brings with it unintended consequences that work against progress.

Of course, the further Congress and the White House go with this agenda to have government play a much larger role the more backlash that will eventually result and via the electoral process some of the most worrisome programs will be blocked. But this takes time to occur, a lot can happen until this shift takes place.

The dollar got hammered again yesterday, which drove commodity prices higher and fueled basic material and energy stocks. Financial, energy, consumer discretionary and industrial shares were best performers. All but one of the 10 major industry groups closed higher on the session, telecoms being the odd man out.

Market Activity for September 16, 2009
Mortgage Applications

The Mortgage Bankers Association reported that their mortgage apps index declined 8.6% in the week ended September 11 following a 17% surge in the week prior. Purchased fell 10.3% for the week, while refinancing activity declined 7.4% -- refis accounted for 61% of the index last week. The 30-year fixed mortgage rate pretty much held steady, ending last week at 5.07% vs. 5.03% in the prior week.

In other housing news, it appears that an extension of the $8,000 refundable tax credit for first-time homebuyers is gaining momentum – most people know what will happen to home sales when it does expire. Congress is currently working on extending it for a year, which would probably pass easily. (For those who may not know, a tax credit means that you receive a dollar-for-dollar credit based on the year’s income tax liability. A refundable tax credit means that you do not have to have an actual tax liability of the credit’s size to receive the entire credit – ie. If the tax credit is $8,000, but you only owe $4,000 in federal income taxes, you get a check for the difference).

Consumer Price Index

The Labor Department reported that the consumer price index (CPI) rose 0.4% in August – as tick higher than the 0.3% expected – pretty much completely driven by the transportation component (of which energy is a part of). As a result, the core rate (excludes the energy component, along with food) remains tame, up 0.1% for the month and 1.4% from the year-ago period. Headline CPI, all items, is down 1.5% an a year-over-year basis, but as we explain in each of these inflation releases, that will change come November when the comparison are no longer against the commodity price spike of summer 2008 and are matched against mild figures.

Retail gasoline rose 9.1%, as measured by this data, and the total transportation component was up 2.3% for the month. The transportation component makes up 15.3% of CPI, so the 2.3% move accounted for 88% of the CPI’s increase in August.

We received the producer price index reading for August yesterday, which showed a large 1.7% increase, or four times the rate of CPI. One wonders if the difference in the rate of increase will begin to raise concerns about profit margins, there are a lot of people – and justifiable so – thinking margins are going to improve markedly due to the rapid pace of firings and other cost-cutting measures within the business community. However, with PPI (business input costs) rising well more than CPI (what they get paid) some may begin to question the rosy margin expansion expectations.

I think the degree to which large-scale firings have boosted productivity will enable firms to absorb these rising costs. However, this may only result in larger profits for a couple of quarters, I don’t think final demand will be enough to keep things going in a prolonged manner due to what the consumer has to work through and a higher level of caution among the business community that will keep business spending at bay. Further, productivity enhancements via layoffs rather than through capital equipment expansion (which is the most powerful driver to a more productive workforce) is a short term situation. But we shall see if people begin to get a bit nervous about profit margins due to the divergence between PPI and CPI.

Net Foreign U.S. Security Purchases

International demand for long-term U.S. financial assets weakened in July as investors purchased just a third of the Treasury securities they purchased in June – although June was a record for Treasury purchases from foreigners.

Net buying of all longer-term U.S. securities (stocks and both government and corporate bonds) totaled $15.3 billion in July compared to a jump of $90.7 billion in June – the figures was expected to increase by $60 billion.

Net buying of U.S. Treasury notes and bonds totaled $31 billion after $100 billion in June. Foreigners bought $28.6 billion of U.S. equities in July after an increase of $19.1 billion in June, and sold $11.1 billion in corporate debt after selling $1 billion in June.

One month doesn’t make a trend, but one wonders how long countries like China will continue to purchases particularly Treasury securities, as least relative to the pace they have over the past few years. They pretty much have no choice, they have to keep buying dollar-denominated assets and this means they’ll continue to buy Treasury bills, note and bonds. The question is to what degree those purchases will slow. Many government and foreign investors are questioning U.S. policy (both fiscal and monetary) and worry that the buying power of the dollar will erode over the next couple of years.

We have seen gold, oil and other commodity prices continue to run and this is probably due in some part to foreign governments easing their purchases of U.S. debt and accelerating their purchase of commodities in order to protect against a falling dollar. It will be very interesting to watch how these capital inflow numbers come in over the next few months (again, specifically with regard to Treasury security buying). For now, the Fed is there to keep rates low, but their purchase program is scheduled to end in December and at that point, outside of some exogenous event, what will stop interest rates from rising from these very low levels?

Will the Fed believe it then must extend its purchase program and move further down the road of quantitative easing (QE)? They have made no overture thus far that this is their plan, but if they do I would expect commodity prices to continue their rally as fears of dollar weakness accelerate.

Industrial Production (IP)

Industrial production rose for a second-straight month, leaving behind the post WWII record decline of the previous 18 months. IP rose 0.8% in August, following a 1.0% increase for July – the August reading outpaced the expectation, which was for a 0.6% rise.

This latest increase in IP was driven again by auto production, but not nearly as much as the previous month in which nearly the entire gain in IP was due to vehicle assemblies. For August, auto and parts production accounted for 33% of the increase. A nice move in machinery production, up 0.8%, also helped to fuel the total manufacturing component of the data.

Utility output, which makes up 10.6% of IP, was also helpful as it rose 1.9% -- a big reversal as it has been down for many months. Mining activity, which also makes up about 11% of total IP, was up 0.5% for the month. This segment too has recorded two months of gains after looking pretty ugly over the past year.

It’s nice to see these improvement, but just to get back to the peak in IP (hit in January 2008) by the end of 2011, production would have to increase at a 5.15% annual rate – the 40-year average is 2.30% per year, so it is unlikely we’ll get back to the early 2008 levels even two years from now.

Capacity utilization rose last month as well, but remains very depressed at 69.6% -- it rose from 69.0% in July. This is just barely off of the all-time low of 68.3% hit in June (this data goes back to 1967). For perspective, the 40-year average is 81.1%.

As we discussed last month, these extreme low utilization rates cause monetary policy makers to have very little concern about future inflation – textbook education teaches that inflation cannot occur with utilization rates at these levels. That’s all nice in a pedagogic setting, but the textbooks don’t include massive Fed liquidity injections and $1.5 trillion in bond purchases by the central bank – the old QE.

My concern, even though I’m not especially upbeat on the likelihood that normal increases in final demand will flow due to consumer issues, is if we get a mild boost in demand the capacity and labor resources currently employed will not be adequate to absorb all of the money floating within the system. That folks is when higher levels of inflation arises.

This is pretty much unchartered territory we’re in, predicting these things is even more difficult than normal. This is why, frankly, I’m sympathetic to the idea of taking these equity market gains of the past seven months and walking away for a while; we shall see how it turns out.


Have a great day!


Brent Vondera, Senior Analyst

Wednesday, September 16, 2009

Afternoon Review: Commodities, ACI, VIX

SPX +1.53%

The markets continued making gains following economic data that showed industrial production is stronger-than-expected.

Commodities put together another broad-based rally. Commodities are in line to have a good year based on a weaker dollar, a rebound in Asia, global procurement policies, and the spreading tide of trade protectionism.


Arch Coal (ACI) jumped 10.32% on higher prices for natural gas (coal’s competing fuel) and speculation that steep output from China will increase. Gas and coal are both used to generate electricity. Metallurgical coal is used to make steel.

Steel output in China reached a record 52.3 million metric tons last month, the National Bureau of Statistics said Sept. 11 in Bejing. That’s 3.2% higher than the 50.7 million tons in July and the fourth straight monthly gain, according to data compiled by Bloomberg.

BHP Billiton Ltd, the world’s largest mining company, said improving economic conditions in China will help drive demand for commodities including coal and iron ore.

Arch Coal is up a whopping 43% since September 2.


The VIX fell for a third day
, closing at 23.69 and approaching its lowest close in more than a year. The index measures the cost of using options as insurance against declines in the S&P 500. The VIX has averaged 20.24 over its 19-year history.


Quick Hits

--

Peter J. Lazaroff, Investment Analyst

Fixed Income Recap


Yields were higher for second day in a row on strength in equities and comments from Fed Chairman Bernanke that the recession is likely over. The curve was slightly steeper as the longer end underperformed and 10- year TIPS breakevens widened a few beeps to finish at +183.7 bps.

The comment of the day award goes to Vince Reinhart from the American Enterprise Institute. "June was mostly likely the trough. Growth will be positive in the third quarter… All that tells you is that market economies do not stay in free fall. That doesn't tell you that we have a durable expansion in motion, it doesn't tell you growth is assured in 2010 and it doesn't tell you that the unemployment rate goes down." Reinhart isn’t the only one sharing views like this. The stock rally is being heralded as the precursor to an economic recovery, but as Peter Lazaroff wrote in his letter yesterday, stocks look pretty rich from a valuation standpoint.

CPI is the big news release today, just now coming in at +.4% MoM - +.1% ex food and energy. More on this tomorrow.


Cliff J. Reynolds Jr., Investment Analyst

Daily Insight

U.S. stocks kept the dream alive, as the S&P 500 pushed above the 1050 mark for the first time since it slid through that number on October 7, 2008 – this puts the broad market higher by 58% from the March 9 low without more than a 7% pullback in June/July; the clock is ticking. The timing of these things is impossible to get exactly right. I’ve expected a correction since 900 on the S&P 500, but it will come so be prepared for it.

The market got its juice yesterday via a robust August retail sales report and New York-area manufacturing that showed additional advances into expansion territory. We’ll get to both of these reports below but I’ll just quickly point out that one-time clunker cash and a price-driven jump in gasoline sales accounted for 85% of the advance in total retail sales – that doesn’t sound sustainable to me, even forgetting about labor-market and household balance sheet conditions.

Commodity-related basic material shares along with the industrial sector led the advance. The S&P 500 index that tracks basic material shares has jumped 76% since the March lows; the index that tracks industrials is up 77% since the rally began.

Volume picked up yesterday as 1.45 billion shares traded in the NYSE Composite, just about in line with the longer-term average.

Market Activity for September 15, 2009
Retail Sales

The Commerce Department reported that retail sales jumped 2.7% in August (exceeding an expected increase of 1.9%) after a downwardly revised 0.2% decline for July. Factoring out the clunker-cash driven sales, ex-autos retail activity rose a strong 1.1% last month on back-to-school buying and the sales tax holiday. (Retail sales were lower by 5.3% from August 2008. This figure is adjusted for seasonal variations but not for price.)

However, adjust for the spikes in auto and gas station receipts and retail sales rose just 0.6% -- still a good number but considerably lower than the headline print.

The clunker cash fueled a huge 10.6% explosion in auto-related sales (vehicles and parts) and undoubtedly borrows these sales from the future. Much like the first-time homebuyers tax credit does with regard to the housing market, but that’s another story. The nearly 11% surge in auto-related sales is the biggest monthly increase since automakers offered zero-percent financing in October 2001 following the 9/11 attacks. Autos and parts made up 18.3% of total sales, which means it accounted for 70% of the month’s jump.

Gas station receipts jumped 5.1%, even as demand was soft, as wholesales gasoline rose 11% in August.

Back-to-school purchases also helped the overall retail figures as clothing sales were up a big 2.4% in August, general merchandise was up 1.6%, sporting goods and book sales (part of the same segment) climbed 2.3%, and electronics were up 1.1%.

The drags on retail sales were housing-related components as building materials fell 1.2% and furniture sales dropped 1.6%.

The core retail sales figure (excludes building materials, gasoline and autos, and is the figure that flows directing into the personal consumption component of GDP -- these exclusions are picked up by GDP in other ways) rose 0.7%. This more than offsets July’s 0.3% decline, so the third-quarter consumption figure is off to a decent start.

The concern is how the market reacts to ensuing retail figures as the next couple of months will not get help from auto-related clunker subsidies – it will be interesting to watch how the holiday shopping season turns out. The consumer has slowed the reduction in household debt levels as result of the clunker program and the reality is this has to be worked down in the face of stagnant-to-low wage data and an unemployment rate that will reach double digits.

(I should note, in terms of incomes and the household balance sheet: As a few people have pointed out over the past couple of months, and Barry Ritholz has most recently, the decline in personal incomes over the past 15 months can be repaired by the Fed juicing the stock market – household balance sheets are certainly in better shape now after this 55% surge from the bottom. How does the Fed juice the stock market? Well, they push short term rates to zero, which means banks have virtually no borrowing cost and can simply invest in longer-term Treasury securities and make a 340-400 basis point spread. The income from this trade can be invested in the stock market, which has surely occurred, and voila, you’ve got balance sheet repair. Of course, there comes a time when this music stops, which has been my concern as everyone knows, but for now it is working.)

Producer Prices Index (PPI)

The Labor Department reported that producer prices rose 1.7% in August, following a 0.9% decline for July – the latest reading was boosted by an 8% rise in energy prices. PPI is up 7.8% over the past four months at an annual rate. The core PPI reading came in up 0.2% for the month.

From a year-over-year perspective, producer prices are lower by 4.3%, but off of this cycle’s low of -6.8% hit last month. As we mentioned via the latest CPI reading, those year-over-year figures will do a 180 as comparisons become very easy in a couple of months – the figures are currently being gauged against last summer’s commodity-price spike that drove the y/o/y inflation gauges to their highest levels since 1981.

Year-over-year core PPI is up 2.3%, which is down from 2.6% last month.

Intermediate goods, the pig in the python with regard to future inflation pressures, rose 1.8% in August. The trend for intermediate goods prices is not all energy related as the core rate is up 4.8% at an annual rate over the past three months. Core crude goods (again core means ex food and energy, and crude goods are those at the very first stage of production) jumped 6.0% in August, which follows a 2.9% rise in July and a 2.6% pick up in June. I think we can dismiss the deflation fears that remain.

Empire Manufacturing

The Federal Reserve Bank of New York reported that its manufacturing index continued to expand for the second-straight month as the Empire reading rose to 18.88 for September (15.00 was expected) from 12.08. Prior to this two-month move the index had registered readings in contraction mode for 15 consecutive months.

This is a really nice number out of Empire, one of the strongest regional factory readings we’ve seen-- the larger manufacturing regions Philly and Chicago have just barely moved to expansion mode. The New York Fed cited vehicle assemblies as the major driver – the business spending and tech equipment indexes both edged lower but remained positive.

The sub-indices were mixed, and this is the part of the data in which one looks for predictive evidence. The new orders, delivery times and average workweek measures all continued to improve. New orders jumped to 19.84 from 13.43; delivery times improved to 1.19 from -10.64 (a higher number means slower delivery times, which suggests they can’t keep up with increased orders); and the average workweek expanded for the first time in 16 months – this is a really helpful development for factory wages and if the entire manufacturing sector exhibits the same trend it will help to offset continued declines in factory jobs.

However, other sub-indices deteriorated a bit. Shipments fell to 5.34 from 14.11 – although likely just a function of slower delivery times; inventory rebuilding has yet to take place in earnest fashion as that gauge fell and remains deep in contraction mode; and employment continued to decline, falling to -8.33 from -7.45 in August. Further, the prices paid/price received differential remains unhelpful for profit margin as prices paid jumped to 20.24 from 13.83, while prices received continued to decline even though it did so at a reduced rate.

Business Inventories

Lastly, the Commerce Department reported that business inventories fell 1.0% in July, a bit more than the -0.9% expected. The June figure was revised lower to show a 1.4% decline vs. the -1.1% initially reported. This data seems like outdated info, particularly since just touching on the September reading for Empire Manufacturing, but it’s important as it does have implications for current quarter GDP.

The sales data rose just 0.1%, which did move the inventory-to-sales ratio a bit lower, but we have yet to see the inventory dynamic take charge (the rebuilding of inventories fully take effect). This July inventory reading was most hurt by a 2.1% decline in auto and auto parts stockpiles. General merchandise inventories declined 0.9%

This will change over the next couple of months as the data will show inventories rising as result of the clunker-driven auto sales as vehicle assemblies have picked up. This component will drive the overall reading and the good back-to-school clothing and electronics sales, as witnessed via the August retail figures discussed above, should induce general merchandisers to boost stockpiles at the margin.


Have a great day!


Brent Vondera, Senior Analyst

Tuesday, September 15, 2009

What next for the market?

Investors continued to chase the market higher, with the S&P 500 making fresh 2009 highs. Market participants have clearly discounted in solid GDP performance for the current quarter, but several big question marks are looming as market participants are ready to wean the U.S. economy off of government support.

Ending this week is the guarantee for the $2.5 trillion money market mutual fund industry, which was meant to prevent a run on the nation’s banks after one fund “broke the buck.” In October, a program that guarantees new debt issued by financial companies is set to wind down. This helped banks roll over their debts while embellishing their earnings. Markets do, in fact, seem ready to have their training wheels removed, but are they ready to ride alone?

The consequences are less certain for the removal other programs whose size and distributions of benefits are a bit more opaque. For example, to what extent have federal purchases supported the MBS market, and how will investors behave when support is withdrawn? Will the market for securitized consumer debt freeze up as the term asset-backed securities loan facility winds down, and will this event directly impact consumer spending?

Speaking of the consumer, no doubt spending has received a shot in the arm from programs set to expire by the year’s end, such as Cash for Clunkers and the $8,000 housing tax credit for first-time homebuyers. Are we simply borrowing future demand to spur sales at the present?

All of this uncertainty makes it easier to accept the arguments for equities being overbought. Driven off its March lows by low yields available on cash and government bonds as well as hopes of economic recovery, the S&P 500 has rallied more than 57%.

Sure companies have handily beaten their earnings, but these estimates were radically lowered heading into the reporting quarter and did not result from sales growth. In addition, global growth has been inorganic and more a result of government fiscal stimulus. And while profit margins have improved, they will likely come under pressure if all the workers being fired in order to maintain profitability spend less and less – not to mention consumers with jobs that are constrained by debt burdens and lower wealth.

Any prospect of lower profit margins makes the S&P 500’s valuation seem even scarier. Today, the S&P 500’s valuation stands at 19 times trailing earnings and 18 times on a normalized trailing 10-year basis – a lofty level normally associated with boom conditions. But if the recovery hopes do not translate into the robust profit recovery the market has priced-in, then it is hard to see how the rally can last.

Of course, market valuation is a poor device for timing a correction since equities have historically remained overbought for extended periods of time. After all, markets have a large degree of self-fulfilling prophecy and a positive feedback loop can do wonders for the market’s direction. And the wall of worry that stocks are climbing is key to the strength of sentiment for the rally.

Still, it’s difficult to ignore the inflated growth assumptions and increasing risks present in today’s markets.

--

Peter J. Lazaroff, Investment Analyst

Fixed Income Recap


Treasuries spent the entire day lower for several reasons, mostly continued rate locking ahead of some large corporate issuance to come and concerns about the sustainability of China’s demand for Treasuries. There was no economic data yesterday and volume remained light for both OTC and exchange markets despite the official vacation season being over.

Lehman filed for bankruptcy one year ago today, so I thought it would be fitting to show a quick snapshot of how far we have come from the panic that followed.
The Ted spread is the difference between 3-month LIBOR and 3-month Treasury Bills. Both are short term rates but they represent two very different markets. LIBOR is a market determined rate that represents what banks overseas charge each other for dollar denominated loans. As credit conditions worsen, banks are less willing to extend credit to other banks. However, during trying times investors flood to the security of short US Treasury debt, driving rates on those instruments down.


The spread between the two represents both bank’s willingness to extend short term credit to other banks and investors willingness to accept low yields in exchange for the safety of T-bills. As you can see from the graph, this spread rocketed higher as the Lehman default spread throughout the credit markets.

More impressive perhaps is the recovery that we have had since mid October. The TED spread finished yesterday at 16.01 basis points and is lower again today. Massive amounts of liquidity being pumped into the system by central banks across the world is the main reason the TED spread has improved as much and as quickly as it has. As long as the access liquidity exists numbers these will continue to improve as money will instinctively search for better yields, and exit strategies from the FED, BOE, ECB and others will test this recovery, regardless of how far they are from tightening monetary policy.

Cheers to the next Bubble!


Cliff J. Reynolds Jr., Investment Analyst

Daily Insight

U.S. stocks began the one-year mark of the collapse of Lehman Brothers on a negative note, but managed to climb back to the flat line by time the afternoon session got underway and continued to it’s highest level in nearly a year to the close on Monday. Despite the market’s soaring 57.5% surge from the wicked low of March 9, the broad S&P 500 remains 12% below its levels of exactly one year ago and 33% below its all-time high hit on October 9, 2007.

On zero economic news, just a Presidential speech from New York on how irresponsible everyone has been and the need for more regulations, the market found reason to extend its amazing rally as utilities, basic material and financials led the move higher. Financials had been lower by 1.3% on the session, but nearly 3% from the day’s low point. (Today we get the August retail sales figure, which is likely to show an increase driven by big auto sales, so maybe traders were looking to get ahead of this news.)

Volume remained pretty subdued with less than 1.2 billion shares traded, roughly 20% below normal; this does not suggest much conviction, but we continue to head higher nonetheless.

Market Activity for September 14, 2009
Again, we were without an economic release yesterday, but this gives us a chance to touch on a couple of topics – the first has been something I’ve wanted to mention for about a week now but haven’t had the space.

The Dollar and Foreign Investing

The Federal Reserve doesn’t seem to factor the dollar’s direction in their policy decision-making process, but they better start thinking about it soon. Bernanke rarely (and that’s an understatement) mentions the dollar in any of his testimonies to Congress – only when prompted. He generally defers to the Treasury Department, but I wouldn’t count on Tim Geithner and Co. to take good care of the greenback’s value – similar to the previous administration, they see no problem with a declining dollar. In fact, I would say they see it as desirable.

Too often policymakers make the mistake of thinking about export activity (a lower dollar value does help our exports as they become cheaper to the rest of the world), while forgetting about the capital inflow side of the economy.

The dollar has plunged in value, against a basket of other currencies, over the past decade. Some of this decline was needed, as the greenback was quite over-valued as result of the world’s rush into the tech bubble in the late 1990s and the ultra safe-haven trade following the 9/11 attacks – both of which drove demand for dollar-denominated U.S. assets, the former drove stock prices and the latter bond prices. However, from say 90 on the Dollar Index the greenback’s decline has not been a good thing in my view and one has to be somewhat concerned about this direction as a falling dollar drives commodity prices higher and can foster harmful levels of inflation – even if that seems to be no concern right now.

In addition, a falling dollar, and especially the perception that it will fall further (driven by the massive fiscal deficits we have now begun to run and very easy Fed policy that keeps interest rates ultra-low), is not conducive to the capital inflows that our economy needs. Further, there’s concern the adverse effect higher tax rates (lowering after-tax return expectations) will have on foreign investments to the U.S. These inflows are necessary to fund capital formation – a pretty important factor with regard to technological innovation (it’s the seed money for that innovation) and the future direction of productivity.

To this point, we all know that the stock market has gone no where over the past decade – virtually flat since September 1998 even including dividends. But in terms of other currencies, due to the dollar’s decline, it is even worse. Since the summer of 2002, when the greenback really began to slide, while the broad market is up 10.33% (or 1.36% at an annual rate) in U.S. dollar terms it has fallen 28.42% in Euros, is down 25.90% in Aussie dollars, off by 20.79% in Canadian dollars and has even declined 17.65% in Yen.

What’s more, keeping interest rates very low will keep the dollar down as it is currently profitable to borrow in dollars, and then turn and sell those dollars to invest in other currencies that offer, or at least perceived to offer, more upside potential and higher interest rates attached. It seems about time we should begin to think about the U.S. dollar again and that begins with the Fed, since we won’t get it from fiscal policy.

One Year Anni

And speaking of Federal Reserve policy:

The financial press, naturally, is focusing on the one-year anniversary of the Lehman collapse – and well they should based on the magnitude and economic reverberations of the event. But we should understand that the demise of Lehman was not the origin that caused the financial system to nearly fail, it was the over-leveraged nature of the system. That over-levered situation was very much encouraged by Federal Reserve policy mistakes that kept rates way too low for way too long.

If the Fed would not have kept real fed funds negative (their benchmark interest rate below the rate of inflation) for nearly three years that over-leveraged state would not have occurred –this was the oxygen for the leverage. Those monetary policy mistakes were driven by too much dependence on flawed Keynesian models, models that put a heavy focus on wage-driven inflation (this led to the Fed’s refusal to move rates higher even when the unemployment rate had moved below 6% in late 2003 – they kept fed funds at 1% until June 2004 and didn’t get back to 3.00% until mid 2005, at which point real fed funds finally went positive for the first time since September 20020.

Will they make the same mistakes this time? We’ll just have to wait to find out, but it seems pretty clear that they will find it difficult to reverse their aggressively easy stance this go around when even an improved labor market will keep the jobless rate well above what is normal.

The Fed has had no choice but to engage in very aggressive easy-money policy over the past 18 months, but that does not mean we shouldn’t learn from the past mistakes that played a major role in the troubles we still face.

Current policy will cause its own problems, problems we can’t possibly know as we sit here today, but we should understand this aggressive easy money policy will make things difficult over the next couple of years, particularly when it is removed. The longer they wait, the tougher it will become for the economy to withstand that reversal and when it is accompanied by higher tax rates…well, that’s something, unfortunately, the stock market will have to begin thinking about.


Have a great day!


Brent Vondera, Senior Analyst

Monday, September 14, 2009

Fixed Income Recap


A strong week in bonds continued into the morning on Friday. The ten-year rallied to 2.27%, level with the low yields we saw in July, before bonds sold off to finish about unchanged as issuers rushed to lock in low yields ahead of this week’s large corporate issuance.

A full economic calendar this week will begin tomorrow with August PPI, and will warm up the inflation watchers for August CPI on Wednesday. Easy money fedspeak, and strong demand for government debt at auctions have sent yields lower over the past month despite a risky asset market that is pricing in a pretty strong economic recovery, all while the dollar has continued to weaken. So what gives? Who has it wrong?

To complicate the situation even further, the administration’s decision to levy an import tax on Chinese tires is being felt in the Treasury market this morning. At a time when the government is relying heavily on foreign buyers of Treasuries – the biggest being China – to fund spending and keep rates low, protectionist decisions like these do not seem logical. Treasuries are weaker to begin today on the news.

Cliff J. Reynolds Jr., Investment Analyst