Visit us at our new home!

For new daily content, visit us at our new blog: http://www.acrinv.com/blog/

Friday, October 23, 2009

Markets down despite nice earnings and home sales data

S&P 500: -13.31 (-1.22%)

Another slew of favorable earnings reports and a better-than-expected report on existing homes sales couldn’t lift markets as strength in the U.S. dollar ha devalued asset prices. All ten sectors finished in the red, although technology shares flirted with positive territory. With a stronger dollar, it is no surprise that energy and materials were the worst performing sectors, both declining over 2%.

The S&P 500 posted a weekly loss of 0.74%.

The biggest gainer on our Approved List was T. Rowe Price Group (TROW), finishing the day 10.51% higher. The rally in equity markets played a big part in TROW’s results, as net cash inflows of $7 billion and market appreciation of $43 billion increased the firm’s AUM by more than 15%. AUM gains has a positive impact on not only revenues, but on profitability as well. Also boosting shares was the fact that contribution rates and asset allocation in the retirement market continued to hold up well, which was a big concern earlier in the year.

The biggest loser today on our Approved List was SunPower Corp (SPWRA), which dropped 14.86%. The lack of upside to 2009 and no specific guidance on 2010 caused investors to dump shares. Also weighing on sentiment is uncertainty regarding feed-in tariffs in Germany, a key market for solar power companies.

Lots quick hits to look over during the weekend…


Quick Hits

--

Peter J. Lazaroff, Investment Analyst

Daily Insight

U.S. stocks returned to rally mode after a two-session respite as yesterday morning’s wave of better-than-expected earnings results (on higher cost-cuts, not aggregate demand-driven revenues) offset higher jobless claims and a decline in home prices, as of the latest home-price gauge.

The broad market began the trading day lower and hovered around the flat line for the entire morning session, but rallied in the afternoon. It did fail to make it back to Wednesday’s intra-day high, before the bottom fell out in the final hour of hump day’s session.

The last two days of trading activity have been particularly interesting as a “key reversal” occurred Wednesday -- I don’t put much credence in this stuff, but the broad market did open above the prior day’s close, made a new high, and then retreated to close below the previous day’s low. Then we began Thursday’s session lower, but maybe because a significant pullback never occurred, traders saw this as a sign to push things higher and that was evident during yesterday’s afternoon session.

A sixth-straight month of gain for the LEI index, a gauge of economic prospects six months out, may have helped the market too. However, I’ve got to think that most people understand the gains in this index are completely driven by the Fed’s zero interest-rate policy and bond purchases (a direction that cannot go on for long, unless the economy were to relapse, and thus will have to be reversed). We’ll discuss this below.

Financials, basic material and consumer discretionary shares led the advance. Consumer staples and utility shares were the laggards, but still managed to post gains as all 10 major sectors ended in the black.

Volume was unimpressive as 1.26 billion shares traded on the NYSE Composite – just below the six-month average.

Market Activity for October 22, 2009
Dollar Rally? Think Again.


The U.S. dollar was rallying a bit yesterday morning, as stock futures were weak – as we’ve talked about, equity market weakness, or a little run for safety, is the only thing the greenback has going for it right now – but reversed course after an interview with Federal Reserve Bank of Boston President Rosengren was aired.

When fielding a question on activity in the dollar, Rosengren stated that the decline was just a result of increased risk taking and is a natural reversal from the greenback’s rally several months ago as we were engaged in full-blown economic and equity market hell. If this view is shared within the central bank in general, which sure seems to be the case, it’s no surprise that the dollar reversed course to end the session lower. The Fed does not believe, or seem to believe, that their zero-interest rate policy and monetization of debt (via quantitative easing) is responsible for the clobbering of the dollar. Now, surely a federal budget situation that is quite the mess is also having an effect on the greenback, but if the Fed isn’t going to acknowledge that flooding the market with dollars is the preponderant element regarding its plunge, then they are in for a rude awakening. And the rest of us may be as well as the aggressive interest rate hikes to rescue the dollar will be needed if they don’t remove their heads from the sand.

Oh, and on the comment that the reversal from the late/2008-early/2009 rally is “natural,” I’ll remind everyone that that rally was from the all-time low for the greenback (as measured by the Dollar Index, which goes back to 1967). We weren’t rallying from some nice level late last year, the dollar was simply temporarily saved from new lows as global investors flood to the U.S. in times of panic due to our deep markets. The fact that the dollar slides again when things appear brighter is not exactly a sign that the world has a great desire to own our currency. What is natural is that the dollar is in decline because of the policy direction.

Jobless Claims

The Labor Department reported that initial jobless claims rose 11,000 last week to 531,000 (515K was expected), halting a two-week decline. Initial claims fell back to 520K in the previous week, still a very elevated level but off of the 550K level that they has been stuck at for a couple of months. The market really needs for initial claims to resume that trend, on its way to sub-500K, in order to offer even a remote indication that some job creation is occurring.

The four-week average held just about steady, coming in at 532,250 after 533,000 in the prior week.


Continuing claims (those drawn for more than one week) fell 98,000 to 5.923 million. This marks the fifth week of decline. However, it is tough to get excited about this move as the vast majority of these people seem to have been moving onto emergency and extended benefit rolls.

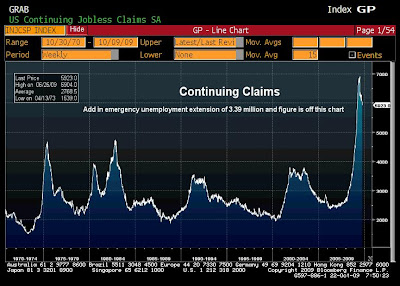
Emergency and extended benefits appear to show the troubles regarding the duration of unemployment persist. First, here’s how it works. When an unemployed recipient of the traditional 26 weeks of unemployment benefits runs out that person can apply for the Emergency Unemployment Compensation (EUC) program, which adds 20 weeks of benefits. When the recipient’s EUC runs out, and still has yet to find (or accept) a job, that person can apply for extended benefits, which offer another 13 weeks of government cash.

What happened last week was that the extended benefits rolls declined by 16,000, but the EUC rolls rose by 40,000. I think the decline in extended rolls was largely due to benefit exhaustion, rather than some form of job creation, which we have yet to see evidence of.


Leading Economic Indicators (LEI)

The Conference Board (a non-profit business organization that has contact to 1600 businesses) reported that its LEI index jumped 1.0% in September, extending the upward trend to six months. The reading is a gauge of economic activity six month out, and from a historical perspective has been a good indicator, but like so many things in this environment one needs to be careful, past indicators may not prove to be as accurate today – I’ll explain below.

The LEI index has bounced hard off of the depths it hit following the credit crisis that began in earnest with the fall of Lehman Brothers in September 2008 as it has been artificially helped by a Federal Reserve policy that has engaged in a number of things to keep rates very low. (This action by the Fed had kept the index from falling to the levels seen in the 1974 and 1980 recessions, it would have moved below those past depths without a zero-interest rate policy, massive liquidity injections and purchases of Treasury and mortgage-backed bonds. In terms of the bounce, these actions have boosted building permits, stock prices and the money supply, and widened the Treasury curve – all components that have led LEI higher over the past six months. Federal government actions such as clunker cash and the homebuyers’ tax credit have also helped to boost LEI over this period.) But does this mean that LEI is saying we up and away from here? Or is it that this is a head fake due to the short-term nature to which Fed and government actions have boosted things?

To be sure, the economy has improved from very low levels. Components of the index such as consumer expectations, jobless claims and the pace of deliveries have also helped LEI of late, but these improvements are from deep lows more than the normal rebound we see during the early stages of the typical expansion.

The components that boosted LEI for September were the slope of the Treasury yield curve (short-term rates much lower than long-term rates – equals massive bank interest income and something that would usually lead to credit expansion, but not the case this time), consumer expectations and a decline in jobless claims (in September). The yield curve and consumer expectations accounted for more than half of the month’s rise – that is a direct move via what the Fed has done. But it falls apart when the Fed must unwind. Even if that unwind is a ways away, we are just kidding ourselves by thinking the expansion has a shot at longevity.

So these are some things to think about when judging the future path of economic activity via this reading – it may not be quite as accurate as it has been in the past. Basically, one only needs to answer one question. If the federal government, and specifically the central bank, were to pull their crutches, their various policies of short-term support, could the economy stand on its own at this time? If the answer to this question is no, then things are not as good as measures such as LEI make it seem. That’s as simple as it needs to be.

FHFA Home Price Index

The Federal Housing and Finance Agency’s gauge of home prices fell 0.3% in August, after three months of increase. This home-price measure is very broad, much more geographically diverse than CaseShiller, but it does miss the higher-end market as it only captures properties with mortgages backed by Fannie and Freddie.

In terms of region, the West and parts of the Midwest eased the downside as the Pacific (HI, AK, CA and OR) and Mountain (MT, ID, WY, NV, UT, CO, AR, NM) regions recorded price increase with the Midwest essentially flat. The weakness was seen in the South Atlantic (FL, GA and the Carolinas) and New England (ME, NH, VT, MA, RI, CT) regions.

On a year-over year basis, FHFA has home prices down just 3.6% and 10.7% below its April 2007 peak. When we average all major home-price measures, prices are down 10.6% y/o/y.

Britain’s Recession

U.K. GDP unexpectedly declined at a 1.2% annual rate in the third-quarter; the number was released this morning. Economists had expected a 0.8% rise, at an annual rate. Whoops.


Have a great weekend!


Brent Vondera, Senior Analyst

Thursday, October 22, 2009

Using the P/E ratio

Investors use the price-to-earnings ratio, or the P/E ratio, to determine how much investors are willing to pay per dollar of earnings. So when I say a company is currently trading at 20 times earnings or has a multiple of 20, the interpretation is that an investor is willing to pay $20 for $1 of current earnings.

In general, a high P/E suggests that investors are expecting higher earnings growth in the future compared to companies with a lower P/E. Historically, stocks with lower P/E ratios outperform those with higher P/E ratios in the long term. A study done by Michael Zhuang confirms this.

Mr. Zhaung took 50 years of stock market data (1958-2007) and for each year separated stocks into three portfolios: the top 30% P/E portfolio, the middle 40% P/E portfolio, and the bottom 30% portfolio. Mr. Zhaung’s data showed that if you invested $1 in each of the three portfolios at the beginning of 1958, then you would have the following returns 50 years later:

  • Top 30% P/E portfolio = $91

  • Middle 40% P/E portfolio = $322

  • Bottom 30% P/E portfolio = $1,698

The results also showed that there was not a single decade, in the past 50 years, in which the bottom 30% P/E portfolio did not outperform the top 30% P/E portfolio. However, this does not mean that low P/E stocks outperform every year. In 2007, for example, the top 30% P/E portfolio outperformed the bottom 30% portfolio by more than 13%.

It’s safe to say that the P/E ratio is a very useful valuation measure for long-term stock investment, but like many other valuation measures, it shouldn’t be used without comparisons. A company’s P/E ratio is more useful when compared with other companies in the same industry, to the market, or against the company’s own historical P/E. Look at the table below:


We don’t gain much out of knowing that CSCO has a higher P/E ratio than LMT because the two companies are in completely different businesses with different growth potential.

We can see, however, that the Aerospace & Defense industry is cheaper than the broader S&P 500, which indicates there is value in this industry. Even more, we see that LMT and GD re cheap relative to its industry peers (represented by the Aerospace & Defense index). We can also tell that LMT and GD are trading below their 5-year average P/E, which also suggests they are a bargain.

Comparing the technology sector to the S&P 500 tells us that the sector has is similarly valued – not too cheap, not too expensive. When comparing CSCO’s P/E to the S&P 500, the technology sector, and its historical P/E, we can assume that CSCO is fairly valued. On the other hand, the above data shows HPQ might represent a good value at this point in time.

It’s important to remember that P/E ratios of companies in very stable, mature industries typically have lower P/E ratios than companies in relatively young, fast-growing industrials with more robust future potential. This applies very well to the above example.


--

Peter J. Lazaroff, Investment Analyst

Daily Insight


U.S. stocks declined Wednesday as the market suddenly reversed course with an hour left in the session – completely the opposite of the trend we’ve seen of late – as the Fed’s latest commentary on the economy may have been more pessimistic that some had expected and a major financial-industry analysts rated shares of Wells Fargo a “sell” late in the day.

Stocks had been chugging along for most of the day, appearing to be aloof to Wells’ earnings report that showed profit was boosted by mortgage-servicing fees rather than improving business trends and non-performing loans climbed 28% from the previous quarter. But the comments from Dick Bove, the analyst referred to above, apparently caused the market to take notice. The decline in stocks, relative to the open, was hardly a rout, but the move from the intraday high was fairly substantial – nearly a 2% move.

News that the Pay Master (did you ever think that such a government job would exist in this country – Ok, the official title is Special Master for Compensation, but what’s the difference?) had decided to slash the compensation of the 25 top employees at seven firms that received government aid, probably didn’t help matters. That news was released in the afternoon, and while I’m sure there won’t be a lot of sympathy extended to these employees, it doesn’t exactly juice market sentiment.

How are these firms going to attain top talent if prospects can’t be sure their compensation contracts won’t be torn to shreds by some bureaucrat? All in all, we’re only talking about seven firms here, and a couple may not even be capable of competing in the global market place. But the U.S. does not want to travel down this central-planning path any further than we already have. I see Mr. Geithner wants to take TARP funds and assist small businesses in attaining financing – small business executives will think twice about getting in bed with the devil.

In the end, nine of the 10 major sectors closed lower on the session, utilities being the only sector to close higher. Financials were the worst-performing sector.

Volume came in at 1.35 billion shares traded on the NYSE Composite, in line with the six-month average.

Market Activity for October 21, 2009
Mortgage Applications

The Mortgage Bankers Association reported that their index of applications fell hard in the week ended October 16, down 13.7%. The index was led lower by a 16.8% decline in refinancing activity (which currently makes up 65% of the measure. The 30-year fixe-rate mortgage rose to 5.07% (sub-5.00% has been the sweet spot) from 4.88% two weeks ago.

Purchases fell 7.6%, after a 5.0% decline in the prior week – the first back-to-back declines since mid-April. It appears we’re entering a hangover period as buyers will probably not be able to close on a contract by the tax-credit deadline of November 30. Thus, we’re either seeing a trend lower in home sales due to the front-loading effect of the rush to collect the $8,000 tax credit (which undoubtedly borrowed from future sales to some extent) or potential buyers are anticipating an extension to the credit and for now will simply wait on the sidelines.


Fed Beige Book

The Federal Reserve’s Beige Book -- its survey of economic conditions within each of its 12 districts, released about every six weeks – stated that its regional banks cited “stabilization or modest improvement,” led by housing and manufacturing activity, from depressed levels. All regions reported weak or declining commercial real estate markets. The Fed regional banks observed “little or no” inflation pressures and demand for loans was “weak or declining.” They saw “further erosion in credit quality” across many districts. Reports of gains in economic activity mostly outnumbered reports of decline, but virtually every reference to economic improvement was termed as “small or scattered.”

My main concern with the Fed summary of economic conditions, well I have duel concerns but this one first, is the reference to the housing market as one of the primarily drivers of economic improvement. I feel a number of things may have come together over the previous few months that caused the housing market to rebound from its cycle low hit in the first quarter. There was the tax credit, very low Fed-induced interest rates, and the best seasonal period for home buying that may have caused a very short-lived improvement. I do not think it is out of the question to wonder if we’re headed for another relapse in housing now that the tax-credit has essentially expired and the buying season has passed. Now housing will depend more on it overriding element – the labor market, which needless to saw is very weak.

The second concern is that the report cited manufacturing activity as the other driver. The sector definitely got a pop from “cash for clunkers,” which was a one-and-done event. Most regional factory surveys have remained in expansion mode of late, but we have seen conflicting data on inventory rebuilding. If this rebuilding is not in full effect, manufacturing activity may have a tough time sustaining these gains. As a result, while I do not personally expect the economy to contract again over the next few quarters, the upward trajectory may be extremely weak.

The best news out of the report concentrated on the tech sector. As earnings reports have illustrated, the only area we’re seeing more than scant evidence of revenue growth (the gauge many are using as an indication of aggregate demand) is within tech services and equipment. The Fed stated many districts observed increased demand for high-tech services.

Overall, business spending plans remained subdued as firms continue to conserve, according to the Fed. Employment conditions were generally reported as weak or mixed, but a few encouraging signs were noted as a couple of districts saw some increase in temp. services.

Earnings Season

Third quarter profit results are shaping up much better than expected. In general, firms continue to blow by earnings expectations, but we have yet to see them deliver on the revenue side.

As firms beat expectations, and some are massively surpassing those numbers, all we hear about is the bottom line results. But this earnings season was supposed to be about much more. When second-quarter earnings season came to an end, the market was planning on intensely watching top line growth (evidence of the direction of final demand) and what firms say about capital expenditure plans with regard to this earnings season. There are a couple of reports over the past two days that I’ve found quite interesting in these respects.

The first was DuPont’s results – the chemical giant that the market looks to for evidence of an economic turn as this is one of the most cyclical businesses out there. DuPont stated that they will continue to aggressively cut costs and reduce capital expenditures, and three of four business segments saw revenues get hammered. Ag. & Nutrition down 5%; Coatings & Colors down 16%; Electronic & Communications down 13%; Performance Materials down 24%.

Then there was Caterpillar’s results, which is another major cyclical and a firm we’ve expected to do well since March due to China’ massive stimulus programs (and their commodity purchases in order to hedge against a declining dollar as CAT’s mining equipment benefits greatly from this). Well, CAT destroyed the earnings estimate by a multiple of 10 (recording EPS of 44 cents vs. the 4-cent estimate – although this means profit was still down 68% from year-ago period). But revenue continues to get crushed, down 43% from the year-ago period and if you think that is an unfair comparison due to last summer’s commodity-price spike, revenues are still down 22% comparing all the way back to the same quarter in 2004.

The most important thing I took from the earnings report was the company’s comments on monetary policy support, as mentioned yesterday. They fear that if monetary policy doesn’t remain floored throughout 2010 the economy (it wasn’t totally clear if they were referring to global or U.S.) will relapse.

These are just a couple of looks, but they are looks at the most cyclical of names, which is important to keep one’s eye on at this point in the cycle

With regard to business spending, which is something this economy desperately needs in order to offset some of the weakness from the consumer side, firms are still not showing a willingness to let go of cash. The exception is in the tech industry, where there is a replacement cycle occurring. But among things like plant and heavy equipment, it will just take a while for spending on these items to make a comeback. There is way too much spare capacity out there, as we have illustrated many times by showing the chart of capacity utilization; this reading remains near its 40-year low. Thus, firms can simply rev up currently idled factories and equipment if they need to produce more. This means less job growth as the need to build new plant and equipment is a massive job creator.

From an overall perspective, as we talked about back in June I think it was, looking ahead we expect to see big bang profit results for two quarters, Q4 2009 and Q1 2010 – largely on cost-cutting. (Right now S&P 500 profits continue to endure a postwar record-setting ninth quarter of earnings decline).

The problem is that since firms have cut payrolls so aggressively, it’s highly likely we’ll lack the final demand needed in the quarters ahead to keep the earnings streak going. Oh, and with oil prices now above $80 and gasoline looking like its headed for $3, final demand will be pressured that much more.

Consider these things, in addition to the coming tax hikes, poor credit quality that may just keep loan activity depressed, and the opening of Pandora’s Box due to intense government intervention and maybe you can understand why I’m concerned about the current level of stock prices.


Have a great day!


Brent Vondera, Senior Analyst

Wednesday, October 21, 2009

Daily Insight

U.S. stocks lost ground on Tuesday, reversing pre-market enthusiasm that followed the morning’s earnings releases, as worse-than-expected news out of the home construction industry and a particular comment from Caterpillar gave traders some pause. It’s also likely that traders held back from getting in front of a number of bank-industry earnings scheduled for release today before the bell.

The market did pare its losses, recovering about half of the morning-session decline as the day wore on, something we’ve seen a lot of lately on days in which stocks come under pressure.

The housing starts figure was a bit of a shock to the market as the latest revisions showed starts actually fell in the previous month and thus won’t provide quite the boost to GDP that was expected. The reading on housing permits, a gauge of future activity, declined and single-family building permits in particular fell by the most since March – which happens to be the month before housing starts hit the cycle low.

More than the housing number though, comments from Caterpillar may have had the primary effect on market activity. The company seems to be counting on global central banks to keep monetary policy floored (which isn’t exactly a stretch) or they fear the global economy will relapse into recession – a recession, according to CAT, that would result in “an even worse recession than the one just ended.” Needless to say, the company doens’t think much of the expansion is self-sustaining argument.

Nine of the 10 major sectors declined on the session, the S&P 500 index that tracks technology shares ended the session unchanged. Utility, basic material and consumer discretionary shares were the worst performers.

Volume was fairly weak again, as 1.17 billion shares traded on the NYSE Composite – that’s roughly 10% lower than the six-month average, but a bit higher than that of the past 10 sessions.

Market Activity for October 20, 2009
Producer Prices


The headline producer price index reading continues to bounce all over the map, falling 0.6% (expected to come in unchanged) for September after the 1.7% jump in August. It all depends on the monthly direction of the gasoline component right now, which jumped 23% in August, leading to that large 1.7% rise in headline PPI. For September, gasoline fell 5.4%, and headline PPI was down, as just stated. For October, gasoline (as measured by the wholesale price) is up 13% thus far, so we’ve got a good idea that PPI will print a pretty strong increase when released next month.

For the year-over-year comparison, PPI is down 4.8% from the year-ago period – although this is being compared to a level that is just slightly off of the all-time high (Summer 2008’s commodity price spike that has oil at $140/barrel and copper at $4/lb., etc. The y/o/y figure will have a positive sign in front of it by November when the comparison becomes much easier.

The core PPI reading (and for new readers “core” just means that energy and food components are excluded) fell 0.1% last month and is up just 1.8% from the year-ago level.

Overall, headline producer prices present little problem for the Fed right now, as is true with all inflation gauges.

The two components of this data to watch, which seems to be largely ignored but is a great indication of future trends, is the crude and core intermediate goods readings. The crude goods reading (not to be confused with crude oil, this is just the goods at the earliest level of production) jumped 3.6% in September and has soared 60% at an annual rate over the last three months. Now, productivity eases the vast majority of costs at the initial level of production, but I mention it only to offer some color as to the degree of increase. The core intermediate goods reading (the next stage of production) rose 0.9% in September and is up 7.2% three-month annualized. These components show the rise in commodity prices may begin to present an issue for the headline inflation gauges a few months out.

Housing Starts

Housing starts rose 3,000 to 590,000 at an annual rate in September, which gets the figure back to the June level. The readings of the previous two months had shown improvement from the June level, but the latest revisions to those readings now show and overall decline occurred in housing starts since June.

The September reading was 20,000 less than expected as economists estimated starts to rise to 610,000. A 15.2% decline in multi-family construction was the drag on the overall reading. Single-family construction rose 3.9% in September after a 4.7% decline in August.

Below are long-term charts of housing starts and permits, going back to 1960.

Permits, a gauge of future construction, fell 7,000 to 573,000 at an annual rate.

The market will be waiting for that extension to the homebuyers’ tax credit; I would be extremely surprised to see Congress punt this one. Since many are now expecting an extension (and possibly offering the credit to all homebuyers and boosting the actual credit amount) this may lead to a harsher deterioration in both starts and sales as homebuilders and potential homebuyers wait for the new support.

Dollar Down

We’ve talked a lot about the dollar for a while now, a discussion I’d like to think that began well before it became all the rage in the media. The greenback rose ever-so-slightly yesterday but is down 10 of the past 14 sessions. Old green really has nothing going for it right now. The direction of tax rates, massive budget deficits and the flooding of dollars into the system all weigh on the buck.

The only thing that looks able to rescue the U.S. dollar here is the same thing that rescued it from the all-time lows hit in 2008 – that is the safety trade. (When I refer to the all-time low on the U.S. dollar it is via the Dollar Index, which goes back to 1967. This measures the U.S dollar against a basket of other currencies.) This is not what you want to see, needless to say. You don’t want the only thing our currency has going for it to be economic and stock-market weakness.

(For those curious about that spike and precipitous decline in the mid-1980s, I’ll explain what occurred below)*

Banks appear to be on a quiet road of asset erosion and this has me increasingly concerned. In order to protect capital ratios due to eroding assets, banks simply borrow from the Fed at roughly 0% and lend that money back to the Treasury – T-bill/note holdings are counted as capital. This is not a growth story. A growth story would be to lend that money to small and medium-sized businesses, which would help drive activity, jobs and incomes. But banks can’t do that right now as they remain in a precarious situation.

And this is where the safety trade comes back in. If the banking system endures another leg of significant asset erosion, the safety trade will flow again because people will understand exactly what it means for the economy in the very near future. This is the kind of stuff that causes the greenback to rally lately, such as the massive safety trade that occurred when we went through hell late/2008- early/2009. When this is all the greenback has going for it, it doesn’t have anything going for it.

Only sound policy will cause a shift in the reasons to own dollars and when sound policy returns, the U.S. dollar will rally again on good news, which is the way it should be.

* The spike and precipitous decline in the Dollar Index in the mid-1980s occurred when the Plaza Accord was agreed upon in 1985. The dollar soared in the early 1980s due to the powerful economic expansion that began in 1982 and was rip-roaring by 1983 -- actually termed the miracle of 1983 by a number of foreign governments as coming out of the 1970s everyone thought the U.S. was in decline; sound familiar? Decline is a choice not an inevitability and we chose to remain the global leader. Anyway, a turn to sound monetary policy and smart economic policy in the early 1980s allowed for the U.S. economy get on its horse, which lasted for the next 20 years nearly unabated. But as the world was amassing dollar-denominated assets in the mid-1980s, the U.S. worried that such a strong dollar would continue to hurt exports and other governments worried that their currencies were too weak relative to the almighty dollar. So, the G5 -- now an even goofier organization of basket cases as it is currenlty the G20, no wonder they can’t get anything done with all of these competing self interests -- decided to sell dollars and that brought the greenback back down 90 or so on the Dollar Index.

Have a great day!


Brent Vondera, Senior Analyst

Tuesday, October 20, 2009

UnitedHealth (UNH) posts big profit, but vulnerable to reform

UnitedHealth Group (UNH) said profit jumped 13% as rising Medicare enrollment offset a drop in private-sector clients lost to unemployment. Upgrading computers, more efficient claims processing, and other cost-cutting steps also beefed up the bottom line. The results were particularly strong given the low confidence expressed by investors recently.

The amount of premium revenue spent on clients’ medical care, the medical loss ratio, came in better-than-expected at 82%. The medical loss ratio is used to gauge future profitability. Expenses were higher than the year before due to the H1N1 flu and the rising number of unemployed customers in the government-subsidized Cobra, where medical use tends to be higher. Revenue increased about 8% to $21.7 billion, more than a third of it from Medicare.

While Medicare’s growth has been a bright spot, it leaves UnitedHealth vulnerable to funding cuts from Washington. There is a very good change that any healthcare bill passed through Congress will limit insurers’ profit margins by cutting Medicare reimbursements, imposing a $6.7 billion-a-year tax on the industry, and banning insurers from denying coverage to sick people. Goldman Sachs Group analyst Matthew Borsch estimates that legislation may cut UnitedHealth’s EPS growth to 6% a year over the next decade, compared with 10% a year if nothing changes.

On the positive side, UnitedHealth can simply raise premiums and slash benefits. This would normally cause membership attrition, but this may not happen if everyone is required to have insurance and other insurers will be raising premiums as well (which is likely). Another positive is that reform legislation is likely to create new subsidies to enable low-income families and individuals to purchase private insurance, thus expanding UnitedHealth’s customer base. Even more, expansions to Medicaid would benefit UnitedHealth’s Americhoice segment.

Either way, this is probably the last time earnings will serve as a catalyst for investors for a while. Instead, all investor focus is squarely on Washington.
--

Peter J. Lazaroff, Investment Analyst

Pawn operations boost First Cash Financial Services (FCFS)

First Cash Financial Services (FCFS) said profits jumped 21%, exceeding estimates on strong revenues, and the company raised full-year 2009 guidance. Revenue increased 12%, 20% excluding currency effects, on the continued strength of its core pawn businesses in the U.S. and Mexico. Pawn-related revenue represented 82% of year-to-date total revenue.

One of the headwinds facing the U.S. economy has been access to credit for people who are at the lower end of the income spectrum (and who also represent the greatest default risk). As lenders ration credit in response to record-high delinquency rates, people are scrambling for cash. Accordingly, pawn shop business is up 40% in the U.S.

It should be no surprise that First Cash Financial Services (FCFS) was able to smash earnings expectations. The pawn-shop operator remains one of our favorite small-cap plays in this environment. Longer-term, we look to their Mexico operations to be drive revenue and profit growth for years to come. Enhancing the firm’s competitive advantage is their older and more mature network of operations in Mexico, which allows them to capture more growth than their competitors.
--

Peter J. Lazaroff, Investment Analyst

Daily Insight

U.S. stocks resumed their upward trajectory on Monday for really no apparent reason other than analysts recommended buying shares of commodity-related stocks and positive expectations of earnings reports coming later this week.

It was a slow news day yesterday with regard to economic data, all we received was a gauge of sentiment among homebuilders. The report is not one of the widely watched releases, and it unexpectedly fell to boot, so it’s not like anyone can point to this data as yesterday’s market driver.

In terms of analysts’ recommendations, as we’ve touched on a number of times now, Wall Street’s bandwagon mentality is in full swing. RBC Capital Markets suggested buying shares of Caterpillar. As a firm that owns Caterpillar, we thank them for the boost the recommendation gave to the stock yesterday. But let’s get serious, the stock already has a lot of good news prices into it. I can see recommending the shares when they were at $25 back in March, but now that the shares trade at $57 (and 29 times next year’s earnings estimate)…well, that’s where the bandwagon part comes in.

Diversified manufacturer Eaton Corporation did report better-than expected profit results before the bell, that certainly put futures on the right track and the positive sentiment flowed into the official trading session. But the revenue side saw declines in all divisions – down 26% all told from the year-ago period. The bottom line was helped by a slashing of employees and the shutting of plants (oh, and the one-and-done event that was clunker cash, which boosted the automotive unit). There was no sign of a pick up in aggregate demand, which is what I thought third-quarter earnings were supposed to show.

We need to be aware of these realities. Getting carried away will only get one in trouble in this market, many have forgotten this after the surge from the March lows but it will remind us all again – obviously I have no idea when; I can only say what valuations makes sense based on the reasonable prospects of economic growth and historical precedent, which is why I’m skeptical of the current leg of this rally.

All 10 major sectors participated in Monday’s rally. Volume was fairly punk as just 1.035 billion shares traded on the NYSE Composite.

Market Activity for October 19, 2009
Crude

The price of oil for November delivery approached $80/barrel as crude is up $10 in eight days – closed at $79.40 yesterday. This is completely the down-dollar trade as demand fundamentals justify a price closer to half this level. But, commodities (hard assets and oil in particular) look to be melding into the new currency the world wants as they seek to hedge against a dollar that continues to decline in value. And speaking of the dollar…

Dollar Policy and Then Some

I caught last week’s CNBC interview with Treasury Secretary Geithner in which he was asked about his thoughts on the direction of the dollar. He pretty much side-stepped the question that pertained to the current direction of the greenback, but commented that the government needs to get its fiscal house in order to boost the value of the buck over time. What does this statement say?

First, the Obama Administration, just as the Bush Administration wrongly exhibited, is just fine with a weak dollar right now. They need exports to make the GDP numbers look marginally better. But this is a dangerous game as the lack of confidence in dollar stability will come back to haunt. The point of this comment is to make clear that despite what Treasury says about wanting a “strong dollar,” it’s just talk – nothing new there for those who watch these things, but we’re hearing an exceptional level of “strong dollar” comments as the greenback gets slammed.

But to the question above, when Geithner says we need to get our fiscal house in order, what he is signaling is the administration’s focus on raising tax rates. Surely, no one believes we’ll see a decline in spending considering the huge government programs Washington is currently attempting to erect (fiscal year budget deficit totaled $1.42 trillion, or 10% of GDP and double the previous postwar record – expect worse for 2010).

Nor are we going to get pro-growth policies that attack the economic side of things as a way to drive incomes, job creation and entrepreneurial desires in order to increase the tax base – the correct way of driving government tax revenues, in my opinion. No, we will see higher tax rates, and these higher rates will not only arrive via the expiration of the Bush tax rate reductions (end of 2010) but from new U.S. experiments, such as value-added taxes and raising the social security tax income cap.

This isn’t just about the Treasury and the Obama Administration in general though, one would be quite wrong to let the Fed off the hook, there is more than just a fiscal element to the dollar’s value. The Fed has the monopoly on dollar creation and so long as they keep policy floored (emergency level rates for an “extended period”) the dollar will get trounced. So, between tax rates, massive budget deficits and the flooding of dollars into the system nothing is going in the dollar’s favor from a fundamental aspect right now.

This is just the political cycle we are in and it’s vitally important to be aware of it.

Beyond just the dollar situation, there was something else I found disturbing from the interview. It was the overt statement from Geithner that “the world will depend less on the U.S. as the engine of growth.” This is exactly the defeatist attitude that marginalizes countries over time. I also find the statement highly offensive for anyone who believes in American interests.

To the contrary, we must do everything we can to make sure the U.S. remains the leader in every regard, but especially in the area of economic status – everything else either flourishes or falls apart from there, depending upon whether we take the reigns and say we’re going to make the 21 century another American century, or we take this defeatists attitude and slowly relinquish our lead.

NAHB Housing Market Index

The National Association of Home Builders (NAHB) reported that the index tracking confidence among homebuilders slipped in October after three months of mild increase. Economists had expected the index to rise again.

The coming expiration of the first-time homebuyer’s tax credit has homebuilders very worried, concerned enough that both the NAHB and NAR (National Association of Realtors) sent a letter to the White House yesterday asking for a one-year extension – and to expand it to include all homebuyers, increase the amount of the credit and to make the credit available at closing. Well, now that’s going for the gusto!

The housing market has benefited from many crutches: the Fed’s quantitative easing campaign (Treasury and mortgage-backed securities purchases in order to drive interest rates lower); government agencies such as Fannie, Freddie and the FHA, which make up the vast majority of mortgage originations; and the first-time homebuyers tax credit. You take away just one of these, the tax credit, and the housing market relapses. I’m not saying it would make a new low, the level of home purchases in January (the cycle low) is not likely to be tested. But this is a microcosm of the economy in general. Take the crutches away (and the support cannot remain in place for long, soon enough the economy will have to be tested to find if the expansion is self-sustaining) and we‘d be lucky to post 0.5%-1.0% GDP over the next year. The market seems to be pricing in 3%-4% GDP growth, if only for a short period of time. It seems to me the rubber will have to meet the road when it comes to equity-market valuations.

Fed Speeches

We’ll have something like nine speeches from Fed officials this week. It was be interesting to see how the market reacts to these comments. If recent history is any guide, the speeches will be quite conflicting in nature as some central bankers seem to have no problem keeping monetary policy floored, while others commiserate over the perils of such action.

Indeed, if the Fed were to gently raise rates right now it may very well have a positive effect on stock prices and the dollar would surely rally. (I believe a mild increase in fed funds, going to 50 bps next meeting and another 50 in December would be helpful – bringing fed funds to 1.00% would still be massively accommodative, it would only take away the abyss-type emergency easing that Bernanke continues to extend; we are out of abyss-type circumstances right? That’s what stocks are saying.) Certainly, banks would feel a little more pressure as the zero-interest rate policy is all they’ve got right now.

However, the longer we keep policy at emergency levels, the harsher the unwind is going to be – the effect on the economy will be pronounced. But hey, when the punch is spiked, very few want to call an end to the party.

Last call? You’re not throwing this crowd out yet. Besides, Bernanke is the liquor patrol agent right now and he’s telling the bartender to keep serving.

Earnings and Futures

Apple reported fabulous results last night after the bell, awesome top and bottom line growth. So what we have here is good results from Intel and IBM, and great results from Apple. The rest of the universe has yet to show revenue growth, which is what we heard last quarter that everyone would be looking for. As a result, futures are mixed as the NASDAQ is up big, while the S&P 500 is down, but not by much.

Correction:


Yesterday, in explaining the deterioration of credit quality within the banking system I stated: Bank of America’s non-performing loans fell 9.1% from the previous quarter. I obviously meant to state that non-performing loans rose 9.1% from the previous quarter. Sorry for the confusion.


Have a great day!


Brent Vondera, Senior Analyst

Monday, October 19, 2009

Easy Money: Stocks rally and Dollar falls

S&P 500: +10.23 (+0.94%)

Stocks rallied ahead of the many earnings reports due this week and a statement from the New York Fed today suggesting that the Fed funds rate will remain in place. The Fed statement was music to commodity traders’ ears, with crude oil plowing through $79 a barrel.

When measured in Euros, the price of oil is just below its June high, so there is little doubt that part of the oil price rise is a result of the slide in the U.S. dollar. The tumbling dollar has received heavy media attention, which is warranted considering its near record lows against other major currencies and gold. The dollar’s decline is mostly due to the loss of the “safe-haven” premium it obtained during the financial crisis.

It’s important to remember, though, that the dollar remains well above the low reached in early 2007 – a time when the U.S. economy and stock market were strong and budget deficits were much smaller. This doesn’t mean the dollar looks healthy. If the dollar were to fall below its 2007 low – about a 6% drop measured against the DXY index of developed countries – then we should be concerned. And you can bet the Fed would bid farewell to their zero-interest-rate policy at this point.

Hopefully the Fed doesn’t wait for such a moment to raise interest rates from emergency levels. The calls are getting louder for the Fed to at least tap on the breaks, with Barron’s cover article saying the Fed should raise rates to accommodative levels from crisis levels. After all, it was easy money that helped inflate the housing bubble that eventually popped. And this time around the Fed has bought more than $1 trillion in bonds!


This is a relatively light week on the economic data front, with PPI and Housing starts focus tomorrow, and Jobless claims on Thursday. Earnings will be this week’s main theme with 155, or about one-third of the S&P 500 firms, reporting quarterly results.


Quick Hits

--


Peter J. Lazaroff, Investment Analyst

Daily Insight

U.S. stocks ended the week lower on Friday as disappointing results from General Electric and Bank of America weighed on investors sentiment. The latest consumer confidence reading, deteriorating when it was expected to remain flat compared to the previous month, didn’t help matters. For the week, the broad market managed a 1.5% gain.

Friday’s consumer confidence measure and Bank of America’s earning report dovetailed in that they both illustrated the headwinds the consumer will face for some time to come. Bank of America’s non-performing loans fell 9.1% from the previous quarter, driven by credit-card and home-equity loan defaults. This is a direct result of the highest jobless rate in 26 years, and surely what’s keeping consumer confidence readings at recessionary levels. You can bet confidence will take an additional hit once an unemployment rate of 10% headlines the news – we’re likely to hit that mark before year end since the figure is already at 9.8%.

(I’m not sure the market has completely come to grips with the rather high possibility that credit (loans) will continue to contract. Banks are still hoarding capital as credit quality deteriorates. The zero-percent policy from the Fed is not helping this situation either as it’s a no brainer for banks simply to borrow for nothing and buy Treasury securities. This helps banks hold onto capital as loan losses continue to grow, but means you can forget about credit expansion, and that has big implications for growth. Six months ago I was thinking this hoarding of capital situation would have eased by now; it has not and I’m not seeing an end in sight until we can get a sustained economic rebound.

These events offset a very nice industrial production reading. This very important indicator has risen for three-straight months now from the deepest contraction in IP since 1946. Most of this bounce has been driven by auto assemblies. Machinery orders jumped in the previous month, suggesting we’d get some help from business spending, but the figure slumped again in this latest reading. Over the next couple of months, all we may have going to boost IP is colder weather (helping the utility segment) and higher commodity prices (boosting mining activity). But until business spending comes back IP will remain choppy.

Financials led the market lower on Friday. Consumer staples was the best performing sector.

Decliners beat advancers by nearly a 4-to-1 margin on the NYSE Composite. Volume was higher than the six-month average, a pretty rare occurrence these days and probably not something you want to see on a down session (it would be nice to see big volume on a rally day).

Market Activity for October 16, 2009
Foreign U.S. Security Purchases

Net foreign purchases of long term U.S. assets rose $28.6 billion in August. Treasury security purchases increased $23.9 billion, slower than the $31 billion increase in July. Purchases of U.S. stocks rose $10.5 billion, much slower than the $28.6 billion increase in July. Purchases of U.S. corporate bonds fell $6.6 billion, a bit of an improvement from the $11 billion decline in July – but still a decline.

This data is obviously not real time as it is a couple of months old, but it’s definitely worth watching for the trend. It’s important to consider that the U.S. dollar (as measured by the Dollar Index – gauged against six major currencies) was near 80 in August, now it looks to be on its way to the record low (since the index’s inception in 1967) of 71.

It will be interesting, and vital, to watch the trend in foreign purchases of U.S. assets now that USD is headed back down. I’ve heard many people talk about how U.S. financial asset purchases by foreigners will increase because the lower dollar value means that these assets are on sale. That may be true if the dollar begins to rise again. However, if it continues lower (or even is perceived to head lower) that “on sale” situation turns into a rout when foreigners convert back to their home currency.


Industrial Production

Federal Reserve figures showed industrial production (IP) rose 0.7% in September (way better than the 0.2% increase expected), marking the third-straight month of increase following the deepest and longest contraction in production since coming out of WWII.

There are three main components of this data: manufacturing, utility and mining activity.

Manufacturing production rose 0.9% (this component makes up 79% of the overall reading), boosted by another huge month for auto assemblies. The production of motor vehicles & parts rose 8.1% after August’s 6.1% increase. This sub-component alone accounted for half of the total rise in IP. Machinery production fell 0.9% and computer and electronics production increased 0.5%.

Utility production fell 0.7% after a large 1.9% increase in August (this component makes up roughly 10% of the total IP index). Mining activity rose 0.7%, surely boosted by higher selling prices as commodity prices have been in rally mode (this component makes up the remaining 10% of the IP index).

So, what does the next couple of months look like? I would expect the reading to relapse a bit as the main driver of IP over the past three months – auto assemblies – will fall off.

Auto sales for September returned to low levels after August’s clunker-cash pop. Colder weather will help the utility component, but some of the weather-related rise will be offset by higher vacancy rates. Mining should continue to run too, but with autos weighing on the largest segment of IP (manufacturing) I think one should expect some weakness in the months ahead. The caveat would be a rebound in machinery production, but I just don’t get the sense that business is confident enough to increase orders.

Capacity utilization rose to 70.5% from 69.8%, still very weak and gives Bernanke & Co. cover as they believe (by their current statements and past actions) that there is little cost to pay for keeping monetary policy aggressively easy. I believe history proves otherwise. There are plenty of future costs to bear and it is not just all about wage-push inflation (or lack thereof, which is what the Fed means when they implicitly state that low capacity utilization rate offers them a green light to keep policy floored); we shall see.

Here’s an illustration of the continued weakness of capacity utilization:


University of Michigan Confidence

This number surprised on the down side as the University of Michigan’s consumer sentiment reading fell back below 70 (the number was expected to roughly remain at the September reading of 73.5).

The headline reading fell to 69.4 in October and the economic outlook (consumers’ prospects for the state of things six months out) fell to 67.6 from 73.5. Even at these low levels, this is not a great surprise considering the labor market situation. And as the jobless rate continues to rise, this will keep a foot on the throat of consumer expectations.

These consumer confidence readings haven’t had much bearing on the stock market historically. I for one have found them pretty much worthless in the past, as long-time readers may recall. But these days, with a lack of credit expansion (therefore we cannot count on easy credit to drive the economy out of recession as it had over the last two cycles) and a jobless rates that resides at a 26-year high (and will test the post-WWII record) these consumer confidence readings carry much more meaning for, and bearing on, stocks.

October 19

Today marks the 22nd anni of the 1987 market crash. The Dow lost 22.6% on the day; the broad S&P 500 plunged 20.5%. Declines of that magnitude were obviously quite shocking; but to borrow from the debut album of Jane’s Addiction, nothing’s shocking anymore in the world of financial markets after what we’ve gone through.


Have a great day!


Brent Vondera, Senior Analyst