U.S. stocks gave back early-session gains as energy and financial shares put pressure on the broad market. The day’s major economic release, the weekly jobless claims data, actually offered the best result on the direction of claims we’ve seen in a while; however, a negative energy report reminded the market of the economic weakness and lack of demand that remains – more on that below.
Traders sort of put the screws to energy stocks after that report, and financials took a little heat too as RealtyTrac stated U.S. foreclosures surpassed 300,000 for the eighth month in a row. The bigger issue is the inventory that has yet to hit the market as banks are delaying the foreclosure process.
All 10 major S&P 500 sectors declined on the session, although the broad market jumped 6% over the past couple of weeks so a day of weakness is hardly consequential. The S&P 500 has bumped against the 1100 mark twice now, yesterday and on October 19, only to retreat. This is probably going to be an important level for technicians over the very short term.
Eight stocks fell for every one that rose on the NYSE. Some one billion shares traded on the exchange – that’s three days in a row now; the six-month average is 1.25 billion.
The $16 billion 30-year Treasury auction didn’t go quite as well as the 3 and 10-yrs earlier in the week, but those were very successful auctions – this one was still pretty good considering the duration. The yield was a bit higher than the pre-auction expectation (4.469% vs. 4.424%) and the bid to cover was 2.26, down from the 2009 average of 2.43. Indirect bidders (foreigners) totaled 44%, which is in line with the 2009 average.
These long bond sales are definitely trickier events as 4.46% for 30 years only looks good in this low inflation, weak economic environment we find ourselves. But with Fed at zero, the dollar’s trend lower and the largest budget deficits since WWII (all factors that have great potential to crush the long bond), the government is surely very happy people are out there buying this stuff at these levels.
Market Activity for November 12, 2009 Crude Oil
The weekly Energy Department report showed crude supplies rose 1.76 million barrels last week to 337.7 million (5% above the 5-yr avg. for those keeping track) – a one million barrel build was expected.
Gasoline stockpiles rose 2.56 million even a refinery runs are at the lowest level since Hurricanes Gustav and Ike hit the Gulf coast n September 2008. Refineries operated at 79.9% of capacity (the average rate is closer to 88%). Demand is ugly, fuel consumption tumbled 4.3% to 18.3 million/day last week (12% below average).
This report is not a good sign for those expecting average economic growth to emerge.
Mortgage Applications
The Mortgage Bankers Association’s index of applications rose 3.2%, fueled by an 11.3% jump in refinancing activity for the week ended November 6 – this follows a 14.5% surge in the prior week as the 30-year fixed mortgage rate held below 5.00% for these two weeks. We’ll note, the refinancing index running at only a third of 40% of where it was back in April and is just 30% of the spike during the refi wave of 2003 – the vast majority of those who can refinance their mortgage likely already have.
The purchases index fell 11.7%, marking the fifth-straight week of decline – the purchases index fell to the lowest level since December 2000 (and that is only because of an anomalous one month slide in 2000, one really has to go back to 1998 to match this level of purchases. Apparently, a sub-5.00% 30-year mortgage rate isn’t enough to unfreeze buyers as they saw the tax credit expiring. That credit has been extended now and we will see if it has the same effect on sales as it had over the previous few months. It all depends on the degree to which the original timeline of the credit front-loaded home buying. Of course, home sales also have to contend with troubled labor market conditions. Those thinking housing is out of the woods need to think again.
Jobless Claims
The Labor Department reported that initial jobless claims made additional progress last week, falling 12,000 to 502,000 – this is the lowest level since hitting 488K in early January.
 Continuing claims fell for an eighth-straight week, down 139,000 to 5.631 million, although more because of traditional benefits running out than job creation, as the exhaustion rate chart illustrates below.
  Extended benefits also show there is some expiry going on as the EUC (Emergency Unemployment Compensation) program showed claims rise (more recent laid off workers moving from traditional to EUC), while extended benefits fell (the longer-term unemployed exhausting the extensions).
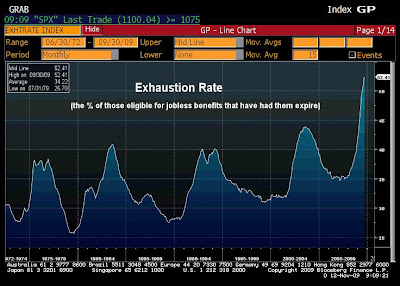 All in all, the claims data suggest that the pace of firings continues to decline, yet a pick up in hiring has yet to become evident.
But it’s Friday, so have a great weekend!
Brent Vondera, Senior Analyst
No comments:
Post a Comment