Visit us at our new home!

For new daily content, visit us at our new blog: http://www.acrinv.com/blog/

Thursday, September 3, 2009

Daily Insight

U.S. stocks extended the losing streak to four days, longest since May, as a preliminary employment report suggested job losses in August will be worse than expected – we get the official jobs report tomorrow – and members of the FOMC expressed “considerable uncertainty” over the strength of economic recovery.

Stocks spent most of the day hovering around the flat line. A relatively significant move lower about an hour into trading was quickly erased, but the second move lower occurred in the final 20 minutes as time ran out.

A gain in basic material stocks helped to support the broad market, the group was one of only two of the major sectors to close in the black. Gains in metals prices, driven by a gold price that’s headed back to $1,000 per ounce, led shares of mining companies higher.

There are all kinds of explanations for the current move in gold: the Indian wedding season (I like that one, although I shouldn’t rip on the notion as the final four months of the year are generally good for the metal); China increasing its holding of hard assets to protect against a declining dollar; and investors anticipating a September/October stock-market sell off.

Financials led the decliners again yesterday, down about 1% after Tuesday’s 5.26% slide.

Breadth was ugly for a second-straight day as decliners beat advancers by a two-to-one margin. Volume remained strong, for this summer’s activity that is, as 1.3 billion shares traded on the Big Board.

Market Activity for September 2, 2009
Mortgage Applications

The Mortgage Bankers Association reported its mortgage apps index fell 2.2% in the week ended August 28 after two weeks of big increases – up 7.5% and 5.6%. Purchases fell 1.0% and refinancing activity declined 3.1% even as the 30-year fixed-rate mortgage fell back to 5.15%.

Preliminary Employment Reports

Challenger Job Cuts Announcements

The job cuts survey out of the nation’s premier executive outplacement firm, improved for a sixth month and the year-over-year reading has improvement for three-straight months.

According to the Challenger Job Cuts survey, planned firings fell 21% to 76,456 in August from 97,373 for July. The number improved by 14% on a year-over-year basis from the 88,736 in job-cut announcements in July of 2008. The latter figure is the one to watch as the survey does not adjust for seasonal effects so the monthly change can be deceiving.

The government and non-profit category led the layoff announcements in August. (While non-profits will remain in a world of hurt for a prolonged period, the coming increase in government jobs will make sure this category will not be leading the survey for long – most of the cuts from this category resulted from the U.S. Postal Service slashing 30,000 positions) The auto industry followed with 6,694 layoffs – this was a surprise. The other surprise was the 5,500 job-cut announcements from the health-care industry, the only component of the monthly employment data (the actual component is health-care & education) that has yet to post job losses during this downturn.

ADP Employment Report

The preliminary employment report from ADP Employer Services estimated that 298,000 payroll positions were shed in August on a seasonally-adjusted basis -- the estimate was a decline of 250K. This marks the smallest decline since September 2008 and suggests that the official employment data will remain below the -300K mark.

ADP estimates that the service-providing sector cut 146,000 positions and goods-producing positions to be down by 152,000. These are higher numbers than the improvement we saw in July’s official data. Service industries cut just 128K vs. the 200K+ avg. for the previous three months and goods-producing industries cut just 119K in July, up from the 190K avg. during the previous three months. By way of the ISM and regional factory gauges, many are expecting goods producing to continue to improve. As a result, if this ADP figure is accurate it could be a blow to the market when the official report is released tomorrow.

Small businesses (those with less than 50 employees, and the main engine for job creation) led the declines with a payroll decline of 122,000. Medium-sized firms (less than 500 employees) shed 116,000 payroll positions and large firms cut 60,000. Again, these are estimates.

Final Revision to Q2 Productivity

The Labor Department released their final print to second-quarter productivity, showing the measure surged 6.6% at an annual rate, revised up from 6.4%. This is the fastest move in nearly six years as firms squeezed more out of existing workers in the face of large revenue declines.

Productivity, a measure of output per hour worked, was able to jump last quarter as hours worked (the denominator in the figure) fell much more than output. Hours worked plunged 7.6% (the figure fell to 33.0 hours per week during the quarter, the lowest reading since these records began in 1964). Output fell 1.5%. This is a big decline in output, but obviously not compared to the damage done in hours worked.

What does this mean for corporate profits? As we’ve discussed a couple of times now, this indicates we’re set up for high-powered profit growth a couple of quarters out.

However, one should be careful not to get carried away. The massive reduction in employment and hours worked also means incomes have been drained and the impairment may last longer to reverse than is generally the case. (The productivity boost is not one of an upsurge driven by capital equipment enhancements but rather the abnormal damage done to hours worked and payrolls)

This does not bode well for consumer activity (a consumer that will already be in the process of working down debt levels, now made marginally worse by the clunker-cash program). As a result, aggregate demand may remain depressed. Therefore, we may not see much improvement in corporate top-line growth and thus may see profits turn down again after a two-quarter upswing – again, that upswing is still another quarter out.

This forecast, I must admit, is made all the more difficult due to the government spending that will flow next year. With the bulk of the Obama Dreamliner stimulus plan (the $787 billion in public spending) rolling in 2010, this may help to keep profits moving on an upward trajectory longer than would otherwise be the case in this environment, particularly for the industrial and basic materials sectors. But one should not believe that the normal expansionary path for profits (that typically lasts for years) will occur this time. The consequences of this heightened government spending and very easy monetary policy stance will develop into a large cost for the economy to bear in the not-to-distant future.

The FOMC Minutes

The Federal Reserve released the notes from their August 11-12 meeting, which showed some concern over the pace of economic recovery and discussion of extending the end date for their mortgage-backed security purchase program, much like they announced when the actually meeting adjourned regarding their program to purchase Treasury securities. The strategy behind extending the time frame, not the actual level of purchases, is to smooth out the process as the program approaches completion in order to minimize any distortions.

On the economy, the FOMC was more upbeat in terms of the downturn coming to an end, but their view about the likely degree of recovery was quite cautious and many members agreed the economy remains vulnerable.

FOMC members expressed that conditions in the labor market remain “poor” and that business contacts have mostly indicated that firms would be cautious in hiring even when demand picks up. The members shared a belief that stimulus and monetary policy would lead to economic growth later in 2009 and into 2010, but that “the stimulative effects would fade as 2010 went on and would need to be replaced by private demand and income growth.” (That’s exactly the concern as one would think interest rates to be higher a year from now and tax rates are set to increase – the combination of these two events is like slipping a mickey to the economy, as we discussed last week. Let’s hope the economy is not robbed and thrown into the alley out back).

It was reported that Fed staffers (these FOMC minutes always include economic projections from the central bank’s staff economists) forecast that economic growth will be somewhat above potential for all of 2010 as financial conditions improve. I didn’t read that in the actual text. Instead, what I read was that staffers stated there were a range of views, and considerable uncertainty, about the likely strength of the upturn – was the press padding things a bit? My how things have changed.

On inflation they believe core prices to remain low. Naturally.

Have a great day!


Brent Vondera, Senior Analyst

Wednesday, September 2, 2009

Defense industry flying under the radar

While the healthcare debate and signals of an economic recovery have dominated the headlines for much of the summer, issues surrounding the Afghanistan war (Operation Enduring Freedom) have been flying under the radar.

Last week brought news that defense needs more than double the place-marker $50 billion estimate for war spending in fiscal year 2011, and perhaps as much as $125 billion. Today there are several reports (see here, here, or here) that Army General Stanley McChrystal may request an additional 21,000-45,000 U.S. troops in Afghanistan, above the 68,000 already there.

Should this large level of troops be needed, the Afghan conflict may begin to resemble the size of the commitment that Iraq had become. Thus defense stocks, especially those with war exposure, could continue double-digit EPS growth beyond the current expectation of slowing growth by 2010. Our Approved List stocks that would benefit the most include Alliant Techsystems (ATK), General Dynamics (GD), and L-3 Communications Holdings (LLL).

Defense companies’ valuations are still far below that of the market because investors have assumed the defense industry would suffer from a U.S. defense-budget squeeze and the market has largely ignored the rising requirement in Afghanistan. However, national security is critical and there is an awful lot going on in Iraq, Afghanistan, and elsewhere.

Uncertainty plays the biggest role in low valuations as the next 18 or so months will have decisions that will shape the industry for a decade or more. Still, these companies are trading just too cheaply to be ignored, especially if the war in Afghanistan continues to grow.
--

Peter J. Lazaroff, Investment Analyst

Fixed Income Recap

The market ignored positive economic data for the second day in a row yesterday as stocks sold off and Treasuries rallied. The two-year is to thank for the steeper curve as it has rallied from 1.05% last Thursday to end yesterday at .91%. I usually prefer to show shifts in the curve with a graph, but some seem to have trouble reading them. Below shows the same change, just in table form.

The biggest news of the day will be the release of the FOMC minutes from the Aug 12 meeting. The market will be fixated on the Fed’s comments on the securities purchase programs, prospects for inflation, economic activity and the dollar. More on this in tomorrow’s recap.

The New York Fed purchased $5.6 billion in 3-4 year Treasuries yesterday and has yet to schedule the next batch of operation dates. The Fed has bought $276 million worth of Treasuries to date, so the next announcement will almost surely have to show some sort of slowing down. Most of the speculation is for the Fed to go to one Treasury operation each week, similar to the way they have bought Agency debt throughout the entire quantitative easing campaign.

Cliff J. Reynolds Jr., Investment Analyst

Daily Insight

U.S. stocks sold off on Tuesday, extending the losing streak to three sessions as it appears the trend we touched on in yesterday’s letter has shifted. Not only does the famous second-derivative trade appear exhausted, but the broad market fell 2.2% on a day in which the manufacturing index posted its first move into expansion territory in 19 months.

One can never make too much out of two or three days of trading, and we should keep that in mind, but the correction that seemed quite overdue after a tremendous run from the depths of the March 9 low may be upon us.

I see there are money managers out this morning stating stocks can’t fall more than 5-10% simply because ISM has moved to expansion mode. One should remind them of the 2002 market. ISM spent eight-straight months above 50 during 2002, yet coming off of a quick 22% rally the S&P 500 went into a 31% freefall at exactly the same time ISM was hitting expansion mode. How quickly memories are erased.

Also weighing on stocks yesterday was speculation across bond desks that a major bank would fail on Friday. Even if this is baseless, the talk of such an event will certainly bring back the vaunted run for safety back to the Treasury market. The 10-year finished 3.37% -- here we go again?

All 10 major sectors declined on the session, led by a 5.26% slide in financial shares. Utility shares were the best performing group on a relative basis, down just 0.72%.

Volume blew by the three-month average. Roughly 1.6 billion shares traded on the NYSE Composite, 33% more than the average for this summer. Sixteen stocks fell for every one that rose on the Big Board.

Market Activity for September 1, 2009
ISM Manufacturing (August)

The Institute for Supply Management’s manufacturing gauge for August jumped to 52.9 (a reading above 50 marks expansion) from 48.9 in July. This marks the first time the nationwide factory index has moved to expansion in 19 months (January 2008). (Yesterday, in getting everyone ready for this reading, I stated the last time it hit expansion territory was September 2008, sorry about that error I was thinking about the Chicago manufacturing reading).

Eleven of the 18 manufacturing industries reported growth last month, that’s up from seven in July.

New orders jumped 9.6 points to 64.9 – a reading that is well-above the 30-year average of 53.8. This sub index was the main driver for the overall ISM number.

The employment index ticked up slightly but remains in contractions mode. I noticed a comment from PIMCO’s Tony Crescenzi yesterday, in which he pointed to the jump in supplier deliveries (another sub-index of ISM) to 57.1 from 52.0 in July – this component of ISM works in the opposite direction, a reading above 50 means slower delivery times.

Crescenzi states that this may mean manufacturing job growth is on the horizon. That would be nice. No doubt the jump in orders has caused some potential bottleneck issues. One can see this in the new order less inventories figure, which jumped to the highest reading since June 1975. But manufacturers understand that the jump in orders is largely driven by the auto sector, and to a lesser extent apparel as the fall line ups roll out. Neither of these factors spells sustained orders growth though, and thus factories are more likely to boost hours worked for current workers than to add to payrolls at this time.

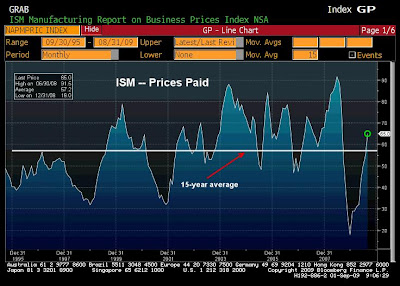
The prices paid index surged. Early inflation signal? We shall see.

Some of this rebound in ISM manufacturing is due to the inventory dynamic. As we’ve talked about for a few months now, the very low state of inventories will encourage firms to boost production in order to rebuild those stockpiles.

But the surge in the new orders index does not jibe with aggregate demand, which has yet to rebound. What is occurring is more than just the inventory dynamic, a function of all business cycle upswings. The boost in vehicle orders is the primary contributor. One can see this by way of the “what respondents are saying” section of the ISM report. The transportation and fabricated metals sectors were clearly the most upbeat, other industries stating activity is on the rise struck a rather cautious tone. Comments from the fabricated metals industry even explicitly stated that manufacturing has increased “thanks to cash for clunkers.”

I noticed an often-quoted economist state, “that the pieces are falling in place for a recovery to take hold.” I wouldn’t get too carried away here. This move in ISM is very welcome, but clunker-cash is over. I wonder if car dealers appreciate people calling this clunker-cash. Since most are still waiting for their government payments, maybe we should call it clunker IOUs.

Prior to this government subsidization, car sales had been in the tank for nine-straight months. This was due to the reverse wealth effect, very weak job market and tighter credit conditions. What occurs once the auto makers have replenished stockpiles? One would think dealer inventories will swell again. Does anyone really believe that car sales will follow a path that is unlike what had occurred before cash for cars?

Unfortunately, instead of a prolonged expansion in factory orders that generally lasts several years in the typical economic recovery, my view is that this one will last only a few months.

In the short-term though, GDP for the current quarter will mark the end of the four-quarter contraction. The latest two readings on ISM average 50.9. I’m guessing economists are upping their third-quarter GDP estimates as we speak.

Construction Spending (July)

Construction spending fell 0.2% in July, following a 0.1% increase for June. The index is down 10.5% year-over-year.

The residential side of things was robust in July as private-sector home construction jumped 2.3% and public-sector outlays for housing rocketed up 3.6% -- that is a huge one month move. (This is a great start to the quarter and suggests housing will lift Q3 GDP, marking the first positive impact from this component in 13 quarters. Again, those GDP estimates are on the rise)

The increase on the residential side, however, was not enough to offset the private sector weakness in commercial construction spending, which was down 1.2% -- down 8.3% y-o-y and lower by 15.8% past three months on an annualized basis.

Looking out over the next several months, private sector commercial construction will remain in the tank, I’m not sure what will happen on the residential side, but it would be a surprise to see a complete recovery in this segment as the inventory/sales ratio for new homes, while much lower, remains elevated. The public sector will take over though and boost this overall reading as the bulk of the government’s stimulus spending has yet to roll out.

Pending Home Sales (July)

Pending home sales continue to roll, up 3.2% for July – the sixth month of increase. Contract signings were fueled by a 12.1% jump in the West (where California’s state tax credit on new home purchases combines with the federal government credit and foreclosure-related price declines) and a 3.1% increase in the South. Pending home sales fell 3.0% in the Northeast and 2.0% in the Midwest.

This data suggests we’ll see another nice month for existing and new home sales when the July data is released. We’re heading for that tax credit expiration, have to close by November 1; we’ll see what happens to sales after that – unless it is extended, which some have speculated.

Another Big Find

BP has reported a giant discovery at the Tiber Prospect in the Gulf of Mexico that may hold more than 3 billion barrels of oil. The well is located about 250 miles southeast of Houston. Between this and the huge find off of the coast of Brazil not that long ago, the “peak oil” crowd is really taking some blows.

More of this to come, technological improvements will lead to additional finds. Despite what many would like everyone to believe, we are not even close to running out of oil; we should be more focused our own preservation.


Have a great day!


Brent Vondera, Senior Analyst

Tuesday, September 1, 2009

August 2009 Recap

The S&P 500 chalked up its sixth consecutive monthly gain as stocks continue to climb a wall of worry. Domestic mid-cap stocks outperformed its large and small counterparts in August and have a sizeable lead in year-to-date performance. REITs topped all asset classes this month with a gain of more than 14%. Emerging markets and commodities were the only asset classes posting negative monthly returns.

While breadth has been very strong during the rally from March lows, it was very weak in August with only two of ten outperforming the S&P 500 as a whole. Financials drove the entire market in August with a gain of 12.99%. The Industrial sector was the only other one to outperform the S&P 500 with a gain of 4.53%.

There is still a considerable amount of skepticism about this rally and many investors are still sitting on the sidelines. As of August 31, 90% of stocks in the S&P 500 are now trading above their 200-day moving averages – a signal to some that prices have risen too far, too fast. Consumer Discretionary and Industrials have the highest percentage of stocks above their 200-day moving averages at 95%, followed closely behind Financials (94%), Technology (92%), Energy (90%), and Consumer Staples (90%). Utilities rank second to last at 83%, and Telecom is dead last at 67%.

Meanwhile, disappointing retail sales, consumer confidence, and initial unemployment claims readings show that consumers are still holding back, which could dampen the prospects of a rapid recovery. In addition, while the extremely low levels of business inventories are expected to lead to increased activity in the near future, companies may not increase spending for fear of a reversal in demand.

There is little doubt that the rebound in the Chinese market helped to fuel the U.S. market rally, but its stock market has recently declined into bear territory, which raises the concern that other markets might follow. Chinese markets have slid in response to regulators tightening lending standards and taking action reduce soak up excess liquidity.

The yield on the two-year Treasury, a rate tied closely to Fed policy, reached a high of 1.30% on August 7, but fell steadily through the month to finish at 0.96%, a sign the Fed is far from hiking its target for overnight lending. MBS spreads continue to tighten as the general rate environment remains low.

Fixed Income Recap


Treasuries posted gains yesterday despite positive economic data that tried its best to overcome weakness in stock overseas. The two year finished the day at .97%, its lowest yield since mid-July, thanks to New York Fed President William Dudley’s comments the quelled speculation from last week that the Fed was nearing the beginning of its formal exit strategy.

Last week two separate Fed presidents, Richmond’s Lacker and Saint Louis’s Bullard, spoke out on the possibility the Fed may not have to purchase the entire $1.25 trillion in MBS. Dudley definitely leans more toward the majority within the FOMC than Lacker (the only FOMC member who has voted against expanding the monetary base through targeted credit programs), and didn’t seem as confident that things are improving enough to warrant such an aggressive action. MBS didn’t seem to take last week’s comments too seriously, so there wasn’t any real correction to be made on Lacker’s counter argument for the continuation of the program. But still, it was a smart move to come out and say something.


Cliff J. Reynolds Jr., Investment Analyst

Daily Insight

U.S. stocks declined on Monday as the Sunday night (our time) sell off in China caused investors to rethink the rally. Speculation that the Chinese government will implement lending curbs resulted in a nearly a 7% decline in Shanghai, pushing that country’s main bourse into bear territory – down 22.8% since August 4. The Shanghai Composite bounced back a bit last night, up 0.6% after China’s main factory gauge posted a sixth-straight month of expansion.

One would have thought the encouraging economic data in the U.S. (Chicago manufacturing on the cusp of expansion mode, which we’ll get to below) to have offset the overseas event and provide a boost to our market. Is this a shift, or just a one day event?

The trend over the past few months has been that only a mild boost in economic data, off of very deep levels to boot, was needed to spark equity-investor euphoria. We’ll find out over the next couple of days whether or not something has changed here. This morning we get the ISM number for August, it will very likely move to expansion mode for the first time since last September. If this occurs and stocks don’t respond in kind, it will be a clear sign that something has changed.

Yesterday’s decline reduced the August gain, the sixth-straight monthly advance; still the S&P 500 added 3.4% last month. That followed a 7.41% advance in July; a virtually flat June, up just 0.2%; a May gain of 5.31%; and romps of 9.39% and 8.54% for April and March, respectively.

All but one of the 10 major industry groups declined yesterday, consumer staples being the lone sector to buck the trend.

Volume was actually pretty strong, by the standards of the past three months anyway, as more than 1.3 billion shares traded on the NYSE Composite – 13% above this summer’s average. Declining stocks whipped advancers by a five-to-one margin.

Market Activity for August 31, 2009
Chicago PMI

Chicago-area manufacturing activity for August, as measured by the Purchasing Managers Index, moved to the line of demarcation that divides expansion from contraction. The reading jumped to 50.0, following 43.4 in July. The reading for August is the highest since September, when Chicago PMI stood at 55.9.

The reading beat the expectation of a move to 48.0 and I certainly thought it would be another month before we got back to 50, which we stated after the latest factory reading out of Philadelphia on August 20. One would have thought this move to spark a rally in stock prices, but the market actually traded lower on the news before regaining some of those losses later in the session.

A boost in auto production will keep the Chicago reading going for a couple of months. The Chicago factory gauge is highly exposed to the auto sector and the increase in vehicle assemblies coming off of the plant shut downs that followed the GM and Chrysler bankruptcies is playing a significant role (big inventory reduction after “cash for clunkers” kicked car sales higher) However, after a couple of months, as we move to year end, the factory sector will need to find support elsewhere.

The boost in the new orders index to 52.5 from 48.0 was surely driven by the auto sector – first move above 50 in a year. Order backlogs also looked good, not yet in expansion mode coming in at 45.8 for August, but marking nice improvement from a very low reading of 32.1 in July.

The employment index remains in deep contraction, hitting 38.7, but has improved significantly from the cycle low of 25.0 in May. (And on employment, we get the August payroll data on Friday. While the weekly jobless claims data suggest monthly job losses will be worse than what we saw in July, the firming in the auto sector should keep factory employment losses milder than was the case just two months back – this sector showed the rate of decline in jobs losses slowed meaningfully during July and that should continue in August.)

The Commercial Hurt

Investors’ concerns seem to be growing regarding the impact commercial real estate losses will have on the banking system (this time more so with community and generally smaller banks than the big guys). Just as in the residential lending standards when credit was offered to just about anyone based on the assumption that home prices would rise without interruption, commercial lending standards appeared to assume occupancy and rental rates would not abate.

The commercial side always erodes, with a significant lag, when the economy turns down. You have manufacturing properties that go bust due to reductions in output, office properties that see both rental and occupancy rates head in the wrong direction and mall properties take a beating due to a higher level of joblessness. If this situation doesn’t go well it will erode bank-industry earnings power, offsetting the hugely positive impact of a massively upward sloping yield curve (a situation that allows banks to borrow near zero and lend money at much higher rates, effectively helping to offset mortgage and consumer credit woes). According to the FDIC, banks have $1.1 trillion in core commercial real estate loans on their books (and another $590 billion in construction loans); it’s likely the downturn in commercial real estate will be the next hurdle for the economy.

I should make it clear though that trouble in the commercial side of real estate does not have quite the economic impact a downturn in the residential side does as the latter can have a profound impact on consumer activity. Still, losses in commercial loans does affect the availability of credit as capital ratios are diminished.

FDIC “loss shares” – Another Crutch

And speaking of the banking industry, through deals known as loss shares the FDIC is agreeing to absorb losses in portfolio loans of banks that have gone under in order to encourage other banks and private equity firms to come in and buy up the failed lenders. As the WSJ reported, the FDIC is agreeing to pick up more than 80% of future losses for most assets and 95% of losses on the rest – that is, it will cover 80% on the first $xx billion of losses (the actual amount depends on the institution) and 95% of losses above that given threshold. The loss exposure the FDIC will assume may skyrocket due to commercial real estate losses touch on above.

This means you’ll have private equity (PE) investors (also encouraged now that regulators have reduced capital standards on private-equity purchases of failed banks) willing to come in and take over a bank, buying up the assets and capturing potentially large profits over time. As the FDIC will assure against most losses, it’s a great risk/return picture for PE investors. But this is not the way the game is supposed to be played and something will crack. We continue to prop up an array of markets and that just cannot go on without cessation.

(I want to make clear, the FDIC will never have a funding problem, simply because if things get bad enough, Congress will inject as much cash that is needed into the agency – and Congress has already passed $100 billion in emergency funding for the agency.)

Taxpayers will be on the hook for these losses and that very likely means much higher tax rates to come. Also, there is a moral hazard issue if the industry cares little to rework troubled loans because the government is massively subsidizing the losses, making the potential losses even greater. It all comes down to how long it takes the economy to bounce back in a sustained manner. My concern is that increased government involvement delays a sustained economic expansion. We shall see.


Have a great day!


Brent Vondera, Senior Analyst

Monday, August 31, 2009

Fixed Income Recap


The Personal Consumption Expenditures Price Index fell .9% in July from a year ago, slightly lower than the -.8% expected, but a little exaggerated compared to +.1% when food and energy is stripped out. The data was more or less a non-event as far as bonds were concerned, which can be expected since the data was right in line. The ten-year sold off on the data but quickly bounced back as equities opened lower. The morning volatility subsided soon after and bonds cruised toward the week’s close to end just slightly higher on the day.

Tomorrow we will get the minutes from the August 12th FOMC meeting. The market will be focused on any new mentioning of an exit strategy for the Fed, a major factor driving rates as of late. The two-year ended last week at 1.02% and has rallied more this morning to yield .992% as I write this. If more talk about an exit strategy is exposed in this week’s minutes the short end will certainly feel the pain, if not, stocks may feel it instead.

The employment report for the month of August will be released on Friday. The consensus forecast is for unemployment of 9.5%, .1% higher than the initial July number.

Cliff J. Reynolds Jr., Investment Analyst

Daily Insight

U.S. stocks ended mixed on Friday as the Dow and S&P 500 closed lower, while the tech-laden NASDAQ Composite managed a slight gain after better-than-expected earnings results from Dell and a boosted forecast from Intel. Weighing on the broad market was data that showed personal incomes were flat in July, following a decline in June, and traders wondering what will happen to the spending side after August as the “cash for clunkers” program has come to an end.
Despite the mixed results on Friday all three major indices gained ground for the week. The Dow gained 0.27%; the S&P 500 added 0.40%; the NASDAQ Composite rose 0.39%. Among smaller capitulation stocks, the S&P 400 (mid cap stocks) gained 0.50%; the Russell 2000 (small caps) fell 0.28%.

Basic materials, tech and financial shares led the broad market higher. Health-care shares, down 0.91% for the biggest loser on Friday, led the decliners.

Volume remained pretty weak for Friday’s session (1.2 billion shares) and all of last week (an average of just 1.1 billion). We’ve had trading volume average less than 1.2 billion shares over the past three months, that’s roughly 15% lower for this time of year.

Market Activity for August 28, 2009
Personal Income and Spending

The Commerce Department reported that personal incomes were unchanged in July (missing expectations for a 0.1% increase) after a 1.1% decline in June, a number that was revised higher from the 1.3% drop initially estimated. Personal income has dropped 2.4% from the year-ago period.
While the headline figure didn’t show it, the internals of the income data were a vast improvement from what we’ve seen over the past several months. Compensation and wages & salaries (two of the three largest components of the data, personal income from assets being the third) both rose 0.1% in July; this follows eight month of decline. So, even though the 0.1% increase is paltry and won’t do much to help elevate consumption, it’s something. These key components have gotten shellacked over the past 12 months, down 4.2% and 5.1%, respectively.

Regarding other segments: proprietor’s income gained 0.6%; rental income jumped 3.3% (the only private-sector component that has looked good over the past year – up 26.4% past 12 months); personal income from assets fell 1.0%, with a 2.6% decline in dividend income (down a massive 23% y-o-y) and interest income lower by 0.3%; government transfer payments declined 0.2%.

On the spending side, activity rose 0.2%, which was in line with expectations following a 0.6% pick up in June – revised up from 0.4%. Spending was helped by the “cash for clunkers” program, offsetting continued weak results from most retailers. This is evident by way of the internals as non-durable goods consumption (things like clothing, electronics, etc.) fell 0.3% in July, while durable goods (items meant to last at least three years (like cars and appliances) jumped 1.33%. The CARS program should have a larger positive effect on August’s spending activity, but this will be borrowing from the future as income growth will remain weak.

As spending outpaced incomes in July, the personal savings rate (cash savings) slipped back to 4.2% from 4.5% in June and off of its 11-year high of 6% hit in May.

This is what I mean by borrowing from the future. The CARS program is just delaying what needs to occur, a cash savings rate that needs to settle in at roughly 8% in order to get consumers feeling right again – based on current realities within the home, stock and labor markets.

Normally, I don’t make a big deal about the personal savings rate, as the two major savings vehicles (homes and stocks) are generally on an upward trend. But this is not the trend today as both have been hit hard, stocks down 34% from their peak and homes off by 20%. Also, with the unemployment rate at a 26-year high (and likely to move higher before it comes lower) a boost to cash savings is essential. The CARS program also encourages the addition of debt to households and this too will delay a sustained spending rebound.


PCE Deflator
The inflation gauge tied to the personal spending data remained unthreatening in July. The core rate, which excludes food and energy (I’ll predict right now that consumers will become really tired of hearing about inflation gauges that exclude these components a year to 18 months out) rose 0.1% for the month and is up 1.4% year-over-year The headline number (includes every component) fell 0.8%.

This is the situation now, but things will change come November. This is when the year-ago comps becomes very weak. Right now, by contrast, the inflation gauges are being matched against numbers that were very high due to last summer’s commodity-price spike ($145 per barrel oil and $4 gasoline – just to mention the commodities that I’m sure you remember). I’m not saying inflation will rage come November, but it will very likely begin to tick higher. There is some embedded inflation right now, the core rate, while tame, is showing the deflation talk is bunk. Over the past four months, the core rate is up 2.1% at an annual rate.

Again, nothing to get terribly alarmed about in the meantime, but as the economy begins to rebound, even if that progression is a very slow one from a historical perspective, this embedded inflation as I’m calling it will feed more quickly into higher prices. As the Fed keeps rates very low, and there’s a heightened probability they won’t have the will to reverse the current course of monetary policy (when needed) due to a jobless rate that remains high, the inflation gauges will begin to show life again.

No one envies Mr. Bernanke’s position, he will have to work magic in order to allow the economy to strengthen while keeping inflation subdued. The Fed has backed itself into a corner, in my opinion, after several years of misguided policy decisions.

Japan’s Electoral Shift
An electoral landslide occurred, if the polls are correct, in Japan this weekend. The DPJ will take over from the LDP, ending just about 50 years of rule. The Japanese economy will need more than a change in the political leadership; they’ll need to completely change policy, shifting from high tax rates and what has become annual government stimulus spending programs to very low tax rates across the board.

Japan’s main obstacle is one of demographics, the most aged population in the world and getting worse due to very low birthrates. They need an immigration jolt to change things and an aggressive shift in their tax regime will encourage businesses and labor capital to flow into the country. Japan’s GDP has literally gone no where since 1996 and has barely increased since 1992. If this isn’t enough to foster a complete change in their economic policy, nothing is.


Have a great day!


Brent Vondera, Senior Analyst

Friday, August 28, 2009

Fixed Income Recap


The market did a good job absorbing the final chunk of this week’s supply. $28 billion in 7-year notes were sold to the public at a high yield of 3.092%, just .5 bps under the market at the time of the auction’s end, a sign the market was right on top of this one. Other demand measures also showed strength this time around. Bid/cover was 2.74, a little stronger than the 2.61 average for this maturity, and indirect bidders took down 61.2% of the auction, also a strong number.

Many traders were calling for this to be a tough week in bond land. Treasuries held in there last week in the face of strong performance in equities, and some saw a week with $109 billion in new supply as a potential rough period. Well speculators have been wrong so far, as demand for new paper was much stronger than expected.

A second Fed President has now speculated publicly on whether the Fed will need to complete the MBS purchase program as scheduled. Saint Louis Fed President James Bullard said yesterday when speaking to reporters in Little Rock that completing the program on its current schedule may not be necessary. Even though that’s two Fed Presidents in as many days speaking out against the program, the rest of Open Market Committee does not seem to share the same views. The Fed purchased $25.4 billion in MBS last week, much higher than the $23.35 billion weekly average, and over $25 billion for second week in a row. Purchases dropped off in July, only to speed up again in August as the Fed is scaling back the Treasury program. The Fed will need to average just about $25.5 billion a week in order to finish purchasing the remaining $458 in MBS before year end.

Cliff J. Reynolds Jr., Investment Analyst

Thursday, August 27, 2009

Fixed Income Recap


A 5-year auction and Fed buying combined for a long end rally and a flatter curve in Wednesday’s trading. Demand for five-year notes was strong yesterday, bid/cover for the auction was 2.51, stronger than the 2.33 average for the past 4 auctions. Only $2.3 billion in long Treasuries were purchased by the Fed yesterday, well under the $3 billion average for that operation. The market will begin to look closely to see if the Fed continues to slow down their Treasury purchases. While we are on the open market operations front, Richmond Fed President Jeffrey Lacker mentioned in a speech this morning that the Fed may not need to purchase the full $1.25 trillion in agency MBS, sighting an economy expected to grow later this year and improving financial conditions. This is the first mention of this that I have heard, and would certainly be a big step towards “the exit” for the Fed if they in fact ended the program early.

In the docket for today is $7 billion in 7-year notes and the release of the Fed’s MBS purchases from the past week. I don’t expect to see any changes going forward in the MBS program despite Lacker’s comments.

Cliff J. Reynolds Jr., Investment Analyst

Daily Insight

U.S. stocks ended flat on Wednesday as comments from Federal Reserve Bank of Atlanta President Dennis Lockhart, warning of a “fragile” recovery, offset housing data that was far better than expected. A durable goods report, while the headline reading was good, also weighed on the market just a bit as the business spending proxy within the report failed to post an increase.

Trading was perfectly divided as five of the S&P 500 major sectors rose, while five declined. Telecom, energy, consumer (both discretionary and staple) and tech shares managed to gain ground. Industrial and basic material shares led the losers.

The market, after catching a bid on the heels of the housing data, which we’ll touch on below, came under pressure after Fed official Lockhart spoke to the likelihood that the FOMC will keep the fed funds rate low for an extended period.

While this is certainly no great revelation, it does put pressure on stocks simply from the standpoint of the economic outlook, something we touched on yesterday with regard to the last leg of this rally in stocks. Lockhart stated his forecast envisions a return to positive GDP growth over the medium term, but weighed down by significant adjustments to our economy – by which he means tighter credit conditions and lower levels of consumer activity.

Market Activity for August 26, 2009
Five-Year Auction


Another Treasury auction goes well as $39 billion in 5-yr notes were sold at a yield of 2.49%, very close to expected, with a bid-to-cover of 2.51 (indication of demand) vs. the avg. of 2.21. Indirect bids (central banks and governments) were strong at 56.4% of the auction vs. 34.6% avg. No problems thus far.

We’ll have another auction of $28 billion in 7-yrs today.

Mortgage Applications

The Mortgage Bankers Association reported that its mortgage apps index rose 7.5% in the week ended August 21, which follows the nice move of 5.6% in the previous week. Purchases rose 1% in the week and refinancing activity jumped 12.7% after a 6.9% pick up in the week prior.

The August purchases are rebounding after this reading showed a July decline of 2.1%. So, we may see a pullback in the actual August home sales figures (what occurs in this apps index generally flows through to the next month’s worth of official sales) followed by one final push in home sales as result of the refundable tax credit just before it expires.

I’ve heard people talk about how the tax credit-driven sales have run their course as people generally move prior to the school season beginning, but I doubt most first-time homebuyers (must be a first-timer to be eligible for the credit) have children. There has been speculation over the past few days that the credit will be extended to other purchases, or even through 2010. We’ll see. In any event, based on what is currently known, the demand induction from the credit will soon run its course.

The 30-year fixed mortgage rate rose last week to 5.24% from 5.15%.


Durable Goods Orders (July)

The Commerce Department reported that durable goods orders rose 4.9% in July after a 1.3% decline in June (a number that was revised up from the initial estimate of a 2.5% decline). The gauge was fueled by a huge move in commercial aircraft orders (the most volatile component of this data), which jumped 107.2% for the month.

The ex-transportation reading rose 0.8% last month, which followed a 2.5% increase for June (an upward revision from the 1.1% rise estimated last month). This figure has increased for three straight months, up 16% at an annual rate.

Other nice gains came from electrical equipment (up 5.3%), primary metals (up 2.6%) and computers & electronics (up1.6%). Auto & parts also picked up a bit, but less than I was expecting, up just 0.9%. This segment will likely show a nice move when the August durables number is released as the CARS program has driven auto inventories low.

The unfortunate aspect of the report, and the likely reason the equity markets didn’t catch a bid on the higher reading, was the business spending figure. Non-defense capital goods ex-aircraft (the business spending proxy) fell 0.3% in July. This followed two months of gain after the drilling the segment took in the months prior.

The year-over-year decline in this business spending segment is still down 20.4% on a year-over-year basis, but an improvement from the 27.3% cycle low hit in April.

Over the past three months non-defense capital goods ex-aircraft are up 30.9% at an annual rate off of that cycle low hit in April. That was a big time low, with business spending off by 35% at an annual rate over the six months that preceded that low mark. (Go back a full year and this business spending reading was off by 52% as of that April low, but it was a totally different world pre-September 2008, so I don’t find it worthwhile to match the current state of things relative to pre-Lehman/financial collapse data – I bring it up just to offer some clarity).

Manufacturers’ inventories of durable goods do remain elevated at 1.81 months worth – the long-term average is 1.56 months. This figure has me questioning the timeline of the GDP boost via inventory rebuilding. It may take a bit longer to occur than I currently expect.

The shipments of durable goods (and again, these are goods meant to last at least three years) jumped 2.0%, marking the second month of gain as the June figure rose 0.7%. Recall that last month we explained that shipments would rise due to the 2.5% increase in ex-transportation durables orders from June. This gets the third-quarter growth figure off to a good start – durable goods shipments is what flows to the GDP report.

The current quarter will end the year-long contraction in GDP. The inventory dynamic will take over (again the timing of this is in question) as the catalyst and should propel GDP for the next two quarters. After that, we will need final demand to come back to keep the ball rolling; the replenishment of stockpiles, after two quarters of record reductions, cannot catalyze GDP by itself in a sustained manner.

New Home Sales

New homes sales leapt in July, up 9.6% (a rise of just 1.6% was expected), to 433,000 units. The level of sales remains depressed, off of the 27-year low but still well-below the 40-year average of 724K units. So we’ve left the cycle low behind, but it may be a very slow turnaround period back to levels that approach the average. It will be very interesting to watch how sales react when the first-time credit comes off and we move past the best period for home sales.

By region, sales surged 32% in the Northeast (although this is a low level market for new homes, making up just 10% of the total); purchases jumped 16% in the South (the largest new home market, making up 51% of the total); sales ticked up 1% in the West and fell 7.6% in the Midwest.

The median price of a new home was virtually flat for the month, down just 0.14% -- median price is down 12% from the year-ago level, $210,100 vs. $237,300 in July 2008.

The supply figures are really looking good, much better than for existing homes. The number of new home available for sale is down 35% from the year-ago period at 271,000 units – the lowest level since March 1993.

The inventory-to-sales figure (months worth of supply at current sales pace) has declined to 7.5.


Have a great day!


Brent Vondera, Senior Analyst

Wednesday, August 26, 2009

Quick Hits

Cash for Clunkers Part II: Home Appliances

Giving consumers cash for their old cars when they bought new ones was a wild success. Now the government is turning their attention towards subsidizing purchases of high-efficiency home appliances like refrigerators, washing machines, dishwashers, furnaces, and air-conditioning systems.

Details are still being worked out, but the program is expected to be capped at $300 million taxpayer dollars, and will give consumers $50 to $200 for their old home appliances when they purchase high-efficiency upgrades. Unlike the Cash for Automobile Clunkers, consumers won’t get the discount at the point of sale, but instead will have to apply for a rebate.

While the program is being funded by federal dollars, each state is able to determine which appliances will be on the rebate list. The items will most likely have to be Energy Star rated. State plans will be reviewed by the Department of Energy starting in late October, and money could start flowing to consumers by November.

Just as the government program to stimulate auto demand ran out of money in the first week, this program will likely be exhausted quickly. Still, the program should provide a temporary boost to appliance makers and retailers that have struggled.

Here are a few of our Approved List stocks that could receive a short-term boost in revenue from this new program:

Wal-Mart (WMT) – retailer of appliances
General Electric (GE) – appliances
Ingersoll-Rand (IR) – Trane heating, ventilating, air-conditioning systems
United Technologies (UTX) – Carrier heating and refrigeration equipment
Johnson Controls (JCI) – heating, ventilating, air-conditioning contractors


For those looking to take advantage of some government money (errr…I mean your money) the American Recovery and Reinvestment Act of 2009 extended many consumer energy tax incentives for included a number of tax breaks, which you can see by clicking here. Businesses, utilities, and governments are also eligible for these tax credits.

--

Peter J. Lazaroff, Investment Analyst

Fixed Income Recap


The Treasury’s $42 billion 2-year auction was an overall positive to the bond market on Tuesday. Demand measures were just under the recent average for 2-year notes – bid/cover was 2.68 – but the yield came in just 1 basis point higher than the market. Bonds had sold off going into the auction but managed to rally on the results and better prospects for the remainder of this week’s supply.

A heavy selloff in crude oil (-3.12%) hurt TIPS today as breakevens tightened 8 basis points for second day in a row to 174 basis points – essentially where they were before their rally last week. I mentioned late last week that TIPS looked like they got a little ahead of themselves but I was suspecting a selloff in Treasuries to be the catalyst for the TIPS correction. Instead it was much better than expected Consumer Confidence Survey results that boosted the dollar and drove dollar hedges out of oil which in turn hurt TIPS. What a domino effect huh?

The Fed is scheduled to purchase Treasuries maturing between 8/15/2026 and 8/15/2039, a sector that stretches to the very back end of the curve. The Fed has averaged $3 billion in backend purchases per operation but most in the market has come to realize that the Fed will soon need to slow down their purchases significantly. I have heard estimates as low as $1.5 to $2 billion. I’m not sure how much these operations are affecting the market these days anyway, especially when they are accompanied with new Treasury supply and meaningful economic data.
Ben Bernanke was nominated by President Obama for a second term as Chairman of the Federal Reserve Board while being praised for his “calm and wisdom” during the financial crisis. But monetary policy must come full circle before Bernanke’s story is finished. Reappointing Bernanke for the sake of continuity during this cycle removes a hurdle, albeit a small one.


Cliff J. Reynolds Jr., Investment Analyst

Daily Insight

U.S. stocks gained ground Tuesday after the day’s home price data and consumer confidence readings came in better than expected. A successful $42 billion auction of two-year notes (an activity that garners increased anxiety these days) also surely helped the equity markets. More of that to come though, $39 billion in five-year notes today, $28 billion of seven-years on Thursday and trillions more to come over the next couple of years at least – such is the heightened cost for the way we’re attacking the economic deterioration..

However, stocks retreated from late-morning session highs as traders had time to think about the level at which consumer confidence stands and the headwinds the largest segment of the economy still has to endure.

Consumer discretionary shares led the broad market higher on that bounce in the consumer confidence reading. Energy shares led the three sectors that lost ground on the session, as oil prices pulled back to the $71 handle.

Just over one billion shares traded on the Big Board, 8% below even the meager three-month average.

Market Activity for August 25, 2009
The Dollar


The U.S. dollar managed to shake off the reappointment of Chairman Bernanke by managing a mild gain. His easy money ways are no friend of old green; in fairness, the pilot of this cash-dropping helicopter doesn’t have much choice here, which is kind of why some view the latest leg of this stock market rally with skepticism, as the economy needs this easy money crutch. My main criticism is with the Fed policy of the past that played a major role in creating the debt-laden/housing bubble/mispricing of risk scenario that brought us to this state.


S&P CaseShiller Home Price Index

The most-watched home price index showed the June data improved markedly, posting a 1.4% increase – this marks the second month in which this gauge has shown home prices to rise and the June increase was the best since June 2005.

On a year-over-year basis, CaseShiller has home prices lower by 15.4%, which is also the best reading since April 2008. While this remains a harsh decline from the year-ago period, we’ll take the improvement.

The table below shows the vast improvement that has occurred within most cities (focus on current month-over-month vs. previous).


This is great news, but one needs to refrain from getting too excited about this move and surmising the housing market is on a sustained move in the direction needed. (I need to be careful when explaining these things, taking a cautious approach and warning against the tendency to view this as an “out of the woods” indication is dangerous for me at this point as many very likely see those “green shoots.” But I’m sorry; the foreclosure readings are showing the trouble is spreading from the sub-prime area of the mortgage market to the prime segment. We’re seeing prime mortgage delinquency rates move higher as the very weak job market situation will have this affect on things.)

The foreclosure reality will likely put pressure on home prices again as we move to the end of the year (and away from what is almost always the best quarter for home sales, especially so for CaseShiller as it does not seasonally adjust its monthly price data). If the market is going to take the approach that the price declines have completely run their course, there remains an outsized chance that equity values will react harshly to data that shows this not to be the case a couple of months out.

In the end, I have to see some improvement in the job market, an improvement that shows the monthly payroll declines ease from current levels that are commensurate with the peaks seen during the typical recession (that is, monthly job losses need to move below 100K – currently they remain at -250K, much better than we endured a few months prior but still deep losses). We also need to see the housing market show some ability to stand on its own – refundable tax credits and fed-induced interest rates are providing a large boost right now.

Consumer Confidence

The Conference Board’s consumer confidence survey showed a bounce back to 54.1 from 47.4 – halting a two month retrenchment after it appeared as if the reading was on a sustained rise from the record lows hit in March. The reading for August brings us nearly back to the level hit in May, a point that puts the reading closer to the pre-Lehman fallout point of 61.4.

For clarity, the overall confidence survey is an average of respondents’ appraisals of current business conditions, business conditions six months out, current employment conditions, employment conditions six month out, and total family income expectations six months out.

The key aspect of this report for me is the jobs “plentiful” minus jobs “hard to get” reading, which rose above the all-time low hit in July. The measure increased to -40.9 last month from the all-time low of -44.8. (Those stating jobs were “plentiful” rose to 4.2% of respondents vs. 3.7% in July. Those stating jobs are “hard to get” fell to 45.1% from 48.5 in July.

The present conditions index remained extremely depressed, registering a reading of 24.9, compared to 23.3 last month. However, the expectations reading (respondents’ expectations six months from now) jumped to 73.5 from 63.4. This is the highest reading since December 2007.

While the rebound in confidence is a good sign, the figures remain low from a long-term perspective. What people need to realize, in my opinion, is that consumer activity as a percentage of GDP will move back to the historic average of 65%. Presently, it remains near 70%, and hit 72% at its peak as very easy credit conditions, historically low unemployment, solid real income gains and the wealth effect (much higher stock and home prices) allowed this to occur. After the situation we have been through, credit standards have moved to a more appropriate stance, and thus one factor that will move personal consumption back to the historic average over time. Another factor is the weak job market (and I fear the jobless rate will remain stubbornly high for a prolonged period due to the current policy path); the consumer will choose to add incrementally to cash savings as a result.

Over the next couple of quarters, the inventory dynamic and government spending will propel GDP growth but the lower level of spending by the consumer will weigh on the expansion. The business side is still a question. We need business spending to rebound in a robust way to help offset consumer weakness, but we have yet to see evidence of this turn taking place.

Maybe we’ll see an early sign of a business spending upswing in this morning’s durable goods orders report, that would be very welcome. However, if durables are solely boosted by auto production, as “cash for clunkers” helped to erase inventories, this will not offer economic assistance outside of a one-two quarter pop.

Richmond Manufacturing Survey

The Richmond Federal Reserve Bank’s survey of factory activity in the region held steady at 14 for August – same reading as in July. This marks the fourth-straight month of expansion.

The shipments index jumped to 21 from 16; the new order volume slipped to 18 from 24 (still nicely in expansion mode though) and the average workweek rose to 16 from 14 – we need to see this figure rise within all of the factory indices.

The unfortunate development, which I also noticed in last week’s Philly Fed reading, was that prices paid have exceed prices received for two months now. This could put pressure on profit margins, but the huge decline in payrolls should ease this development.

Federal Housing and Finance Agency’s (FHFA) Home Price Index

The FHFA reported its home price index rose 0.5% for June after a downwardly revised 0.6% increase for May. On a year-over-year basis, this measure has prices down just 2.2%. This is a very broad measure of home prices, much broader than CaseShiller, but does miss the high end market as it does not capture purchases made with jumbo mortgages and only includes single-family homes that have mortgages backed by Fannie Mae and Freddie Mac.

Equally weight CaseShiller, FHFA and the median home price via the existing home sales data and you get home prices down 10.9% from the year-ago period – a welcome improvement from the cycle trough of 17.5% that took place in January.


Have a great day!


Brent Vondera, Senior Analyst

Tuesday, August 25, 2009

Four more years of Bernanke

The biggest news today was that Ben Bernanke was nominated for a second term as chairman of the Federal Reserve. Some may view this as a pat on the back from the President for a job well done, but it may also be a move to remove uncertainty from markets.

After all, it’s difficult to judge how well central bankers have performed until many years afterwards. Former chairman Alan Greenspan, for example, received high praise during the dot-com boom, but is now charged with inflating the credit and asset price bubbles that led to the current global financial crisis.

As for Bernanke, he may be remembered as the brilliant student of the Great Depression who averted another one by pulling every lever (and creating some new ones) at the Fed’s disposal. Of course, it’s possible he will be remembered as the man who tripled the size of the Fed’s balance sheet attempting to support financial institutions and, consequently, sparked inflation and destroyed the dollar.

After slashing interest rates to almost zero and pumping $1 trillion into banking system to unfreeze credit markets, Bernanke and Co. must now tackle the difficult task of soaking up liquidity without disturbing the economic recovery. Is growth part of a sustainable recovery or due to a short-term impact of stimulus? This is the question the Fed must answer.

If they believe it to be part of a sustainable recovery, then it is sensible to implement exit strategies. If not, then it might be appropriate to wait and see whether growth has taken root, which entails greater risks of inflation. The Fed has historically been slow to remove stimulus, but with maybe Bernanke can be more aggressive now that he has a bit more job security.

--

Peter J. Lazaroff, Investment Analyst

Fixed Income Recap


The Fed buoyed the front end of the curve with their $6 billion purchase of 2-3 year notes yesterday. The purchase was right in line with the average for that section of the curve, but a bit higher than expectations. The Fed needs to spread the last $32 billion of the $300 billion over the next 8 weeks, so we should expect less frequent operations or smaller sizes going forward. The Fed announced at the last FOMC meeting that the program will be slowed down to end in October, a month later than originally planned, but has yet to adjust the pace of the program.

TIPS had a rough go of it yesterday, losing ground to nominal coupon Treasuries throughout the day with 10-year breakevens ending the day 8 bps tighter. TIPS ran pretty hot last week despite the selloff in nominals, so most of yesterday’s movement was just a correction. Like everything in bond land lately, TIPS are range bound. The spread between the real yield on 10-year TIPS and the 10-year Treasury’s nominal yield has bounced around the 150-200 basis point range since March, and will probably continue to move within that range as sentiment drifts.


The second batch of Treasury supply is scheduled to begin today with $42 billion in new 2-year notes. Two-years are flat as of this writing.


Cliff J. Reynolds Jr., Investment Analyst

Daily Insight

U.S. stocks ended virtually flat on Monday as the broad market erased early-session gains after SunTrust Bank warned of more financial-sector losses ahead. CEO James Wells stated the industry is a “long way from declaring any sort of victory” as lenders face more credit losses and commercial real estate may falter through 2010. The comments were enough to drain momentum that had carried over from Friday’s rally and an increase in international bourses Sunday night.

The Dow average managed a slight uptick as energy shares enjoyed a strong session on crude’s move above $74 per barrel – a 10-month high. Oil is unlikely to retreat so long as the Fed signals it will keep the easy-monetary policy pedal jammed to the floor.

Six stocks fell for every five that rose on the NYSE. Volume remains lackluster as just 1.1 billion shares traded on the Big Board, although this was pretty good activity relative to what we’ve seen lately. Unless something big begins to take place in either direction, volume will remain tepid as is the case for the final week of August as we head for the Labor Day holiday.

Market Activity for August 24, 2009
Treasury Demand

A couple of days back I noticed a Goldman Sachs’ analyst wrote in a note to clients in which he predicted that U.S. based buyers looking to add to savings will produce demand that is sufficient to gobble up the additional trillion dollars in bond issuance coming over the next 24 months.

This will be true; there will always be demand for Treasury securities, but not at these levels – and certainly not in the economic environment the stock market is currently pricing in; it would take a prolonged period of deep economic weakness for people to remain attracted to these yields.

U.S. household holdings of Treasurys (correct plural spelling) hit a record in 1995; that was when the 10-year Treasury traded at an 8% yield. At such a level, even a range of 6.0%-6.5% these days considering the interest-rate environment we’ve lived through over the past seven years (10-yr has averaged a yield of just 4.2% during this period), Treasury securities should enjoy much attraction from U.S. households. But at the current 2.5% yield on the 5-yr and 3.5% on the 10-yr...well, good luck with that one.


Bernanke to be Reappointed

News broke last night that President Obama will reappoint Bernanke to a second four-year term – the decision will be promulgated this morning. The market should like this move as it means continuity and removes uncertainty. In fact, the move is smart in terms of the market as Bernanke has become its sugar daddy.

I do find the timing of the decision a bit strange. White House Chief of Staff Rahm Emanuel alerted the press last night at 9:00 our time. In addition, the President is vacationing on Martha’s Vineyard and the press has been ordered to give him and his family their privacy. The decision to announce his choice of Fed Chairman makes this increasingly difficult. It just seems like they suddenly chose to make the decision now for whatever reason.

And speaking of the Fed…

Leaving Something Out, Conveniently

At the Federal Reserve’s annual symposium in Jackson Hole that concluded this weekend, Chairman Bernanke’s speech touched on the number of things that have taken place during and just prior to the credit crisis. He talked fairly specifically about the intensity of the financial crisis, the policy response, and the elements of a classis panic.

His account of what has occurred, and the decisions made to soften the blow, was quite good and I think he managed his speech with remarkable brevity. He also though touched on, more than once, how the Fed effectively saved the world. If not for the Fed response, according to Bernanke, the global financial system would have collapsed. I must say, there were a couple of weeks there at the height of the crisis in which it appeared it just might.

But one cannot prove a counterfactual so it seems pointless to me to bring it up, but the Chairman was campaigning for his job, and on that basis it seems pretty obvious why he would emphasize that he believes the Fed did a bang up job.

The aspect of this that rubs me the wrong way is if the Chairman is going to remind everyone how the decisions of the FOMC saved the system , one would like to see him also acknowledge that is was past FOMC policy mistakes that played a very large role in creating the situation that made the crisis possible. What I’m talking about here is the length of time in which they kept real (inflation adjusted) interest rates negative, a policy direction that encourages massive increases in debt levels.

Now Bernanke doesn’t have to waste time campaigning for his job (the current term ends in December) and can solely focus on managing the situation we are in – again, part of which is the situation both monetary and fiscal policy have and will put us in. He will have to work nothing less than magic to manage this thing appropriately.

Cash for Houses

The cash for clunkers program came to a close yesterday, but there is talk that Congress will expand another program: the refundable tax credit to all homebuyers – to this point, that refundable tax credit was available to first-time buyers only. I haven’t heard whether extending the duration of the program is part of this effort (currently expires November 30) but one would think they’d go through 2010 if this speculation is accurate.


Have a great day!


Brent Vondera, Senior Analyst

Monday, August 24, 2009

Quick Hits

Fixed Income Recap


Yields jumped 10 basis points or more across the Treasury curve as better than expected existing home sales data drove investors out of the safety trade. New home buyers rushing to make the November 30 cutoff for the $8000 credit and foreclosure sales helped boost the number that posted a 7.4% increase in July, its 4th straight monthly increase.

Before Friday, yields had been steadily creeping to the lower end of the current range – helped by positive news on the supply front and increased Treasury demand from overseas. Bernanke’s comments also reaffirmed the FOMC’s decision to slow down and bring to an end the Treasury purchasing program, saying again that, “Economic activity appears to be leveling out”. The implementation of QE by the Fed was a true crisis decision, so its unwinding should be seen as a response to improvements in the credit markets, not necessarily an immediate rebound in economic growth.


Cliff J. Reynolds Jr., Investment Analyst

Daily Insight

U.S. stocks rallied on Friday as existing home sales rose for a fourth-straight month and Fed Chairman Bernanke stated “fears of financial collapse have receded substantially.” The move in equity prices pushed the broad market higher by 2.20% for the week. The S&P 500 has jumped nearly 17% over the past six weeks.

Friday’s housing data pushed existing home sales higher by 5% from the year-ago period, the first year-over-year gain since November 2005. One wonders what happens to housing again when the tax credit for first-time homebuyers expires in December and interest rates begin even a mild rise, but the market isn’t interested in such thoughts right now.

On the Bernanke comments, I can’t say it surprises me to see traders push stocks higher on his comments, but the move, if it was actually on those comments, doesn’t make much sense as the preponderant reason for most of the surge from the depths in March is because the “Armageddon” scenario has been removed – the market has already priced in this assumption.

This massive rally since the March 9 low has pushed to 54% now. Back in early March just five of the S&P 500 members traded above their 200-day moving average. In a matter of just six months, 457 of the 500 members now trade above their 200-day, according to David Singer. The entire index trades 18% above its 200-day MA, which is double its premium when stocks hit their all-time highs back in the summer of 2007.

Market Activity for August 21, 2009
Existing Home Sales

The National Association of Realtors (NAR) reported that existing home sales jumped 7.2% in July to 5.24 million units at an annual rate. When we separate single-family units from the data, sales were up 6.5% to 4.6 million units at an annual pace – this marks the fourth-straight month of increase off of the 12-year low.

The median price for an existing home fell 2% in July to $178,400 and is down 15% from a year ago -- still ugly, but up from the cycle low of 17.5% in January.

As a result of the sales pick up, the inventory of existing-home supply relative to sales fell to 8.6 months worth of supply, from 8.9 in June. The move from extreme elevation at the end of last year is very welcome, but the current level remains heightened – a number below seven months of supply is consistent with price stability, according to NAR.

This is all good news, but the stock market is pricing in too much optimism in my view. Homes sales are being driven by foreclosure-related price declines (31% of July sales were from foreclosed or distressed properties), tax credits for first-time buyers and mortgage rates that are being artificially held low by the Fed’s mortgage-backed purchases.

Certainly, there is nothing wrong with the sales from the foreclosure-driven price declines; this is the market at work. But the tax credits will expire in three months and the Fed cannot keep buying mortgage securities (pushing the prices higher and the yields lower) for long, at some point this quantitative easing must be reversed. It will be a while (maybe the end of 2010) before this reversal occurs, but I don’t think the labor market will have healed by then and just as their current action has pushed rates lower, the bounce back will be more pronounced as result of these decisions.

The question remains, what happens to home sales at that point? The market will be completely dependent upon labor-market conditions when these programs run out. I think this is something the market needs to begin thinking about.

Mortgage-Security Problems Persist

We put up a chart of mortgage delinquencies on Friday. That picture illustrated that 9.24% of the mortgage market is at least 30-days delinquent, up from 6.24% a year ago and the 30-year average of 4.97%. When you add in loans that are currently in the foreclosure process that number rises to 13.16%, the highest level ever recorded by the Mortgage Bankers Association – this gauge does not go back to the Great Depression, a period in which these figures were much worse.

I found the chart below also interesting. It shows the potential for pent up foreclosures, a situation at least partially due to states placing moratoriums on the foreclosure process. The rest is due to the damage seen within the labor market, exacerbated by too many homebuyers purchasing more home than they could truly afford.

I bring this to your attention after the WSJ ran a story on Friday explaining that banks (and they were talking about smaller banks) have a lot of bad securities in their trading accounts – mortgage-security pools (some with 40% delinquency rates). These positions will have to be written down and will consume some institutions’ entire capital positions.

This is worrisome, but there is one clear way to remedy the situation. We need default rates to substantially slow and real estate prices to rise -- a mild increase is all that is needed. For this we need a burgeoning economy, which will not occur under the current policy path. Instead, we must slash tax rates on labor income, dividends, corporate profits and capital returns; passing all free trade pacts that are currently being blocked by Congress would also be a huge plus. In addition, the implementation of current-year write-down allowance must be made, this will kick-start business spending (which is needed to fill the void from lower consumer activity).

Problem is, these types of policies don’t have a snowball’s chance in hell of occurring right now and this is precisely why caution is required.

Week’s Data

We’ll be quiet today but it will be a big week for economic data releases.

Tomorrow we get two major home prices indices, consumer confidence and another regional manufacturing survey. On Wednesday, we’ll receive durable goods orders for July and new home sales. Thursday will bring the first revision to Q2 GDP and initial jobless claims. We’ll round it out on Friday with the personal income and spending figures.


Have a great day!


Brent Vondera, Senior Analyst