
Stocks got off to a slow start after disappointing jobs data, but ultimately finished higher on the strength of the industrial sector. Today marked the fifth straight advance for the S&P 500, which posted a weekly gain of 2.53%.
Today’s labor report showed that payrolls fell by 190,000 in October versus an expected loss of 175,000. The bigger headline in the media, though, was the unemployment rate hitting 10.2%, the highest level since 1983.
General Electric (GE) led industrials after two separate analysts raised their ratings and share-price estimates. Also contributing to gains were transportation stocks, especially the railroads, which are still rising after Warren Buffett’s lofty valuation of Burlington Northern Santa Fe. (More on this topic can be found here.)
Despite all of press industrials received, the materials sector was the best weekly performer, finishing with a 5% gain. Gold stocks led in the sector, advancing nearly 13% this week. Although the Materials sector was strong this week, the CRB Commodity Index recorded a 1.8% loss on the week. This may not surprise you if you read the September 17 post comparing commodity exposure strategies.
--
Peter J. Lazaroff, Investment Analyst
Friday, November 6, 2009


Fixed Income Weekly
FOMC – Baby Steps
This week’s decision by the Federal Open Market Committee (the committee that determines the Fed’s monetary policy) did some decent market moving this week despite only being one of many baby steps to come.
So what changed from last release? Not much. The committee sees household spending expanding, compared to only stabilizing in September. The previously scheduled $200 billion in agency debt purchases will now be reduced to “about $175 billion”, due mostly to the lack of paper available. Other than that, it was a carbon copy of the statement from the September 23 release. A Barron’s article from a couple weeks ago speculated that some Fed officials were considering removing all or part of the “exceptionally low levels of the federal funds rate for an extended period” phrase from the comments. We didn’t get that much of a switch from last meeting but we are definitely a little closer now.
Fannie Mae – The Landlord
Announced yesterday, Fannie Mae will begin renting homes back to troubled homeowners who prove they cannot afford to pay their mortgage. The new “Deed for Lease” program will offer an alternative to eviction to homeowners who have their mortgage either owned or guaranteed by Fannie Mae. In order to qualify homeowners must be between 1 and 11 months late on their mortgage and cannot qualify for a loan modification. Yes. There are homeowners who are more than 11 months late on their mortgage but still living in their home. Could that be masking some problems from the housing data the market has been juiced about lately? Just a thought…
The leases will be for 12 months, after which they will try to sell the home at a higher price than they could right now. Fannie claims that it is unlikely that homeowners will be able to buy their home back after the lease expires, sighting that the home will only be offered to qualified homebuyers. In reality, the term “qualified” has held several different meanings within the credit universe during the last few years, so who’s to say that someone with a major blemish on their credit history in the last year and no down payment won’t again be considered qualified. It’s a loose term at best. My expectation is for this program to crash and burn just like the mortgage modification program.
Cliff J. Reynolds Jr., Investment Analyst
This week’s decision by the Federal Open Market Committee (the committee that determines the Fed’s monetary policy) did some decent market moving this week despite only being one of many baby steps to come.
So what changed from last release? Not much. The committee sees household spending expanding, compared to only stabilizing in September. The previously scheduled $200 billion in agency debt purchases will now be reduced to “about $175 billion”, due mostly to the lack of paper available. Other than that, it was a carbon copy of the statement from the September 23 release. A Barron’s article from a couple weeks ago speculated that some Fed officials were considering removing all or part of the “exceptionally low levels of the federal funds rate for an extended period” phrase from the comments. We didn’t get that much of a switch from last meeting but we are definitely a little closer now.
Fannie Mae – The Landlord
Announced yesterday, Fannie Mae will begin renting homes back to troubled homeowners who prove they cannot afford to pay their mortgage. The new “Deed for Lease” program will offer an alternative to eviction to homeowners who have their mortgage either owned or guaranteed by Fannie Mae. In order to qualify homeowners must be between 1 and 11 months late on their mortgage and cannot qualify for a loan modification. Yes. There are homeowners who are more than 11 months late on their mortgage but still living in their home. Could that be masking some problems from the housing data the market has been juiced about lately? Just a thought…
The leases will be for 12 months, after which they will try to sell the home at a higher price than they could right now. Fannie claims that it is unlikely that homeowners will be able to buy their home back after the lease expires, sighting that the home will only be offered to qualified homebuyers. In reality, the term “qualified” has held several different meanings within the credit universe during the last few years, so who’s to say that someone with a major blemish on their credit history in the last year and no down payment won’t again be considered qualified. It’s a loose term at best. My expectation is for this program to crash and burn just like the mortgage modification program.
Cliff J. Reynolds Jr., Investment Analyst
Daily Insight
Dow 10,000! Again.
Stocks rallied hard as a number of better-than-expected results removed the wait-and-see attitude that has been the trend the day before a monthly employment report. The market sure seems willing to erase the losses recorded over the previous couple of weeks, undoubtedly helped by the Fed’s latest signal that the Bernanke bullet train will remain a blur – after Wed’s very soft FOMC statement it’s obvious ZIRP is with us for quite a while still as they kept the “exceptionally” low level of rates for “an extended period” wording in place.
Futures started things off higher after much better-than-expected profit and revenue results from Cisco Systems Wednesday night. Then, yesterday morning’s larger-than-expected decline in initial jobless claims and a chain-store sales report that easily surpassed expectations boosted investor sentiment into the official trading session.
Consumer discretionary, financials and industrials (the same groups that led the market lower on Wednesday) led the broad market’s advance.
Trading in the U.S. dollar was very volatile yesterday, but it did manage to gain some ground. ECB and Bank of England presidents Trichet and King signaled they will begin to remove their emergency level of monetary easing. This will not make the dollar’s road any easier to travel as our Fed keeps policy floored. As (if they actually end up doing so) the European central banks begin to gently raise rates and reduce their government bond purchases it should strengthen their currencies relative to the greenback and further boost interest-rate differentials in their favor.
The Fed isn’t even mildly changing course for some time…unless forced to by a catastrophic dollar rout – that seems to be the only thing that could get their attention and end the ZIRP.
Market Activity for November 5, 2009
 Productivity
The Labor Department reported that productivity (output per hour worked) surged 9.5% at an annual rate in the third quarter. To offer some perspective, anything over 3.0% at an annual rate is powerful. It means that firms are able to absorb higher costs and that means they do not have to pass those costs, in full, onto the consumer via prices. But we need to explain a distinction between good productivity, which is longer-lasting, and productivity that is, well, less good as it comes solely from the slashing of payrolls.
The good productivity occurs when firms have the incentive to produce and innovate. This results as investors, the providers of seed money, take calculated risk and finance future innovations – generally driven by higher after-tax return expectations. When this innovation comes to market in the form of equipment enhancements, it means higher living standards -- jobs and real wages are driven higher. This type of productivity was in play over the past quarter century as tax rates on capital and income were reduced from the harmful levels of 70% on income (at the top rate) and 40% on the capital gains tax. Productivity continued to expand through the 1980s, 1990s and 2000s even as 48 million jobs were created in the U.S. over this stretch.
Conversely, the less than good sort of productivity is no friend of those looking for work right now because it arrives only when firms slash payrolls (specifically hours worked). And this is what we’re seeing in these latest productivity readings. (This is along the lines of what we’ve discussed for some time now. Firms will very likely squeeze evermore work out of existing employees, for an extended period, before adding to payrolls – this means a lack of final demand and economic weakness; it’s kind of tough for consumers to boost spending when the jobless rate remains at such heights. It becomes even more difficult when consumers are already burdened by historically high debt levels.
The policy direction of massive deficit spending, and the higher tax rates that follow, will only increase the chances that firms remain cautious and this has additional implications for the labor market. Higher tax rates, and while they are not here yet those paying attention understand much higher tax rates via various forms are a very real threat, will make it difficult for the new innovations needed to keep good productivity rolling without high levels of unemployment.
What drove this latest productivity reading was a 4% annualized increase in output, while hours worked slid 5.0% at an annual rate. On output, this gain was the first after falling for four-straight quarters (two of which saw output decline at record postwar levels). The other part of the equation, the tumble in hours worked marked the eighth-straight quarter of decline.
So these very heightened levels of productivity will prove helpful in the short term (particularly with regard to profits), but the benefit is likely to be fleeting if the correct economic policies are not advanced. The good type of productivity (via capital equipment enhancements, which is dependent upon lower tax rates on both capital and incomes), the type with a longer staying power, may have a rough time getting going in the new policy world it appears we find ourselves. It’s important to make these distinctions.
Jobless Claims
The Labor Department reported that initial jobless claims fell 20,000 to 512,000 in the week ended October 31. This beat the expectation by 10,000 as economists has expected claims to fall to 522K. This is the best move to the 500K level since they fell from 554k in late December to 488K in the first week of January. We have yet to get below what I’m calling the critical 500K level again (a point that is just above the 1991 recession and 2001 downturn peaks), but things appear to be on the right track.
The four-week average of claims fell 3,000 to 523,750 – the lowest level since January before they skyrocketed to 658K. No one expects that to occur again as we’ve gotten past the worst of the payroll declines.
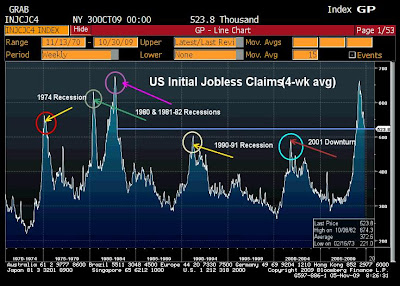 Continuing claims fell for a seventh-straight week, down 68,000 to 5.749 million. As we’ve touched on for weeks now, this reading is being distorted by the exhaustion of benefits, which as of the latest payroll data continues to climb to record levels – as of September the exhaustion rate of the unemployed who had been collecting jobless benefits rose to 52.4%. Tomorrow’s data will shed new light on this reading.
Further, the 68,000 decline in traditional claims was more than offset by the 114,800 increase in emergency and extended jobless benefits.
By the way, Congress, or is it Parliament, has passed another 20-week extension to jobless benefits. I believe this brings the total to 79 weeks for those that are eligible. The extension provides another 14 weeks of benefits in all states, plus another six weeks for those in states with jobless rates over 8.5%. There are 26 states that meet that threshold.
 (Also part of that bill is an extension of the homebuyers’ tax credit of $8,000 to April 30. Buyers who have owned their residence for at least five years would qualify to receive a $6,500 credit if they buy another – they would not have to sell the current home but the new one would have to qualify as their primary residence. Singles making up to $125,000 and couples making up to $225,000 would qualify. The market distorting games continue.)
Chain Store Sales
Chain-store retail sales (which is just year-over-year results for stores open at least one year) rose 2.1% in October, which blew by the expectation for a rise of just 0.1%. This move marks the second month of increase, same-store sales rose 0.1% in September, after 10-straight months of decline. All segments of the data have posted at least 14 months of declines with the exception being discount and drug chains. Thus, the year-ago comparisons have become very easy. Recall that these past two months of increase are compared to the beginning of economic hell when the consumer went into hiding in late September-October of 2008.
Apparel chains saw y/o/y sales rise 1.0%, after a 0.7% increase in September. Luxury chains posted a 1.8% increase in sales, the first in 16 months and those declines were huge averaging -13% y/o/y during this stretch. Discounters posted a 2.5% y/o/y sales jump in October. Drug chains saw sales boosted by 3.4%.
The only segment that continued to post declines was department stores, which extends the y/o/y declines to 16 months.
Overall, this is a good report, but it is off of easy comps and considering the fragility of the labor market results will likely be choppy over the next several months.
Employment Report
All eyes will be on the October jobs report this morning, which is expected to show 175,000 in payroll losses. This will mark the 22nd straight month of payroll declines and the losses have been massive – 7.2 million jobs have been erased over this stretch. We are going to see these declines move to statistically insignificant levels of < 100K per month in short order and one should expect to see mild job increases (yes, increases) by early 2010.
However, it will very likely take at least four quarters of above average (avg. being 3.4%) real GDP readings in order to bring the unemployment rate below 9.5%. (First, the jobless rate must move well above 10% as it always continues to rise even when job creation begins.) I am extremely skeptical above trend GDP results will occur for four quarter in this environment and give zero credence to forecasts that this expansion even comes close to those we’ve seen over the past 25 years.
The Fed is at zero, which means when the tightening campaign begins, it will not look like the normal ¼ point increases. The tightening will be aggressive, and when it occurs at the same time that tax rates are moving higher, the challenge to the economy will be enormous. It will take quick and substantial changes to the policy direction in order to expect otherwise, and even if that occurs, we still have to deal with the reversal of monetary policy.
Have a great weekend!
Brent Vondera, Senior Analyst
Stocks rallied hard as a number of better-than-expected results removed the wait-and-see attitude that has been the trend the day before a monthly employment report. The market sure seems willing to erase the losses recorded over the previous couple of weeks, undoubtedly helped by the Fed’s latest signal that the Bernanke bullet train will remain a blur – after Wed’s very soft FOMC statement it’s obvious ZIRP is with us for quite a while still as they kept the “exceptionally” low level of rates for “an extended period” wording in place.
Futures started things off higher after much better-than-expected profit and revenue results from Cisco Systems Wednesday night. Then, yesterday morning’s larger-than-expected decline in initial jobless claims and a chain-store sales report that easily surpassed expectations boosted investor sentiment into the official trading session.
Consumer discretionary, financials and industrials (the same groups that led the market lower on Wednesday) led the broad market’s advance.
Trading in the U.S. dollar was very volatile yesterday, but it did manage to gain some ground. ECB and Bank of England presidents Trichet and King signaled they will begin to remove their emergency level of monetary easing. This will not make the dollar’s road any easier to travel as our Fed keeps policy floored. As (if they actually end up doing so) the European central banks begin to gently raise rates and reduce their government bond purchases it should strengthen their currencies relative to the greenback and further boost interest-rate differentials in their favor.
The Fed isn’t even mildly changing course for some time…unless forced to by a catastrophic dollar rout – that seems to be the only thing that could get their attention and end the ZIRP.
Market Activity for November 5, 2009
Productivity
The Labor Department reported that productivity (output per hour worked) surged 9.5% at an annual rate in the third quarter. To offer some perspective, anything over 3.0% at an annual rate is powerful. It means that firms are able to absorb higher costs and that means they do not have to pass those costs, in full, onto the consumer via prices. But we need to explain a distinction between good productivity, which is longer-lasting, and productivity that is, well, less good as it comes solely from the slashing of payrolls.
The good productivity occurs when firms have the incentive to produce and innovate. This results as investors, the providers of seed money, take calculated risk and finance future innovations – generally driven by higher after-tax return expectations. When this innovation comes to market in the form of equipment enhancements, it means higher living standards -- jobs and real wages are driven higher. This type of productivity was in play over the past quarter century as tax rates on capital and income were reduced from the harmful levels of 70% on income (at the top rate) and 40% on the capital gains tax. Productivity continued to expand through the 1980s, 1990s and 2000s even as 48 million jobs were created in the U.S. over this stretch.
Conversely, the less than good sort of productivity is no friend of those looking for work right now because it arrives only when firms slash payrolls (specifically hours worked). And this is what we’re seeing in these latest productivity readings. (This is along the lines of what we’ve discussed for some time now. Firms will very likely squeeze evermore work out of existing employees, for an extended period, before adding to payrolls – this means a lack of final demand and economic weakness; it’s kind of tough for consumers to boost spending when the jobless rate remains at such heights. It becomes even more difficult when consumers are already burdened by historically high debt levels.
The policy direction of massive deficit spending, and the higher tax rates that follow, will only increase the chances that firms remain cautious and this has additional implications for the labor market. Higher tax rates, and while they are not here yet those paying attention understand much higher tax rates via various forms are a very real threat, will make it difficult for the new innovations needed to keep good productivity rolling without high levels of unemployment.
What drove this latest productivity reading was a 4% annualized increase in output, while hours worked slid 5.0% at an annual rate. On output, this gain was the first after falling for four-straight quarters (two of which saw output decline at record postwar levels). The other part of the equation, the tumble in hours worked marked the eighth-straight quarter of decline.
So these very heightened levels of productivity will prove helpful in the short term (particularly with regard to profits), but the benefit is likely to be fleeting if the correct economic policies are not advanced. The good type of productivity (via capital equipment enhancements, which is dependent upon lower tax rates on both capital and incomes), the type with a longer staying power, may have a rough time getting going in the new policy world it appears we find ourselves. It’s important to make these distinctions.
Jobless Claims
The Labor Department reported that initial jobless claims fell 20,000 to 512,000 in the week ended October 31. This beat the expectation by 10,000 as economists has expected claims to fall to 522K. This is the best move to the 500K level since they fell from 554k in late December to 488K in the first week of January. We have yet to get below what I’m calling the critical 500K level again (a point that is just above the 1991 recession and 2001 downturn peaks), but things appear to be on the right track.
The four-week average of claims fell 3,000 to 523,750 – the lowest level since January before they skyrocketed to 658K. No one expects that to occur again as we’ve gotten past the worst of the payroll declines.
Continuing claims fell for a seventh-straight week, down 68,000 to 5.749 million. As we’ve touched on for weeks now, this reading is being distorted by the exhaustion of benefits, which as of the latest payroll data continues to climb to record levels – as of September the exhaustion rate of the unemployed who had been collecting jobless benefits rose to 52.4%. Tomorrow’s data will shed new light on this reading.
Further, the 68,000 decline in traditional claims was more than offset by the 114,800 increase in emergency and extended jobless benefits.
By the way, Congress, or is it Parliament, has passed another 20-week extension to jobless benefits. I believe this brings the total to 79 weeks for those that are eligible. The extension provides another 14 weeks of benefits in all states, plus another six weeks for those in states with jobless rates over 8.5%. There are 26 states that meet that threshold.
(Also part of that bill is an extension of the homebuyers’ tax credit of $8,000 to April 30. Buyers who have owned their residence for at least five years would qualify to receive a $6,500 credit if they buy another – they would not have to sell the current home but the new one would have to qualify as their primary residence. Singles making up to $125,000 and couples making up to $225,000 would qualify. The market distorting games continue.)
Chain Store Sales
Chain-store retail sales (which is just year-over-year results for stores open at least one year) rose 2.1% in October, which blew by the expectation for a rise of just 0.1%. This move marks the second month of increase, same-store sales rose 0.1% in September, after 10-straight months of decline. All segments of the data have posted at least 14 months of declines with the exception being discount and drug chains. Thus, the year-ago comparisons have become very easy. Recall that these past two months of increase are compared to the beginning of economic hell when the consumer went into hiding in late September-October of 2008.
Apparel chains saw y/o/y sales rise 1.0%, after a 0.7% increase in September. Luxury chains posted a 1.8% increase in sales, the first in 16 months and those declines were huge averaging -13% y/o/y during this stretch. Discounters posted a 2.5% y/o/y sales jump in October. Drug chains saw sales boosted by 3.4%.
The only segment that continued to post declines was department stores, which extends the y/o/y declines to 16 months.
Overall, this is a good report, but it is off of easy comps and considering the fragility of the labor market results will likely be choppy over the next several months.
Employment Report
All eyes will be on the October jobs report this morning, which is expected to show 175,000 in payroll losses. This will mark the 22nd straight month of payroll declines and the losses have been massive – 7.2 million jobs have been erased over this stretch. We are going to see these declines move to statistically insignificant levels of < 100K per month in short order and one should expect to see mild job increases (yes, increases) by early 2010.
However, it will very likely take at least four quarters of above average (avg. being 3.4%) real GDP readings in order to bring the unemployment rate below 9.5%. (First, the jobless rate must move well above 10% as it always continues to rise even when job creation begins.) I am extremely skeptical above trend GDP results will occur for four quarter in this environment and give zero credence to forecasts that this expansion even comes close to those we’ve seen over the past 25 years.
The Fed is at zero, which means when the tightening campaign begins, it will not look like the normal ¼ point increases. The tightening will be aggressive, and when it occurs at the same time that tax rates are moving higher, the challenge to the economy will be enormous. It will take quick and substantial changes to the policy direction in order to expect otherwise, and even if that occurs, we still have to deal with the reversal of monetary policy.
Have a great weekend!
Brent Vondera, Senior Analyst
Thursday, November 5, 2009
Performance 1-Year After Presidential Election
Yesterday marked the one-year anniversary of the 2008 election. Since the close on November 4, 2008, the Dow Jones is up 1.52%. If you didn’t know any better, you might think the last 12 months were rather uneventful.
I was only planning on using the S&P 500 since it is a broader gauge of market performance, but then realized that data from 1900-1925 (which was unavailable for the necessary 12-month periods) would yield significantly different average returns. As a result, I included the less broad market measure the Dow Jones Industrial Average.
No real or meaningful conclusions can be drawn from this data – obviously there are many factors that contributed to the market’s movements in these 12-month periods. 
I was only planning on using the S&P 500 since it is a broader gauge of market performance, but then realized that data from 1900-1925 (which was unavailable for the necessary 12-month periods) would yield significantly different average returns. As a result, I included the less broad market measure the Dow Jones Industrial Average.
No real or meaningful conclusions can be drawn from this data – obviously there are many factors that contributed to the market’s movements in these 12-month periods.
The table is a bit small, so make sure to zoom in on your browser (press Ctrl and + simultaneously).
--
Peter J. Lazaroff, Investment Analyst
Daily Insight
U.S. stocks sold off in the final hour of trading after spending the entire session higher by about 1.5%. By the time the bell rang the Dow closed up just 0.30% and the broad S&P 500 just 0.10%. I guess it was the old story “buy on the rumor sell on the news” as Fed policy makers kept their aggressive easing campaign in place.
Financial, industrial and energy were the worst performing groups on the session. The fact that energy was down seemed a bit strange on a day in which the price of crude rose back above $80. But think about it. The Fed keeps the pedal to the metal, that doesn’t exactly give the impression that the economy is at all able to stand on its own – as a result, these sectors will lead to the downside. The credit-card regulations coming out of Washington certainly also put pressure on the financials.
The dollar got Bernanke’d, giving up the little progress it had made over the previous six sessions.
Market Activity for November 4, 2009 Mortgage Applications
The Mortgage Bankers Association reported that applications rose 8.2% in the week ended October 30, the first increase in four weeks. Purchases continued to fall though as the homebuyers’ tax credit has effectively expired and potential buyers were uncertain as to the extension.
Refinancing activity rose 14.5% after three weeks of decline (outsized declines over the previous two weeks) as the 30-year fixed mortgage rate moved below 5.00% again.
Challenger Layoffs Announcements
The job-cuts survey from executive outplacement firm Challenger, Gray & Christmas estimated that layoff announcements declined 50.7% to 112,884 last month from October 2008. On a month-over-month basis, layoffs fell 10,725, or 16%, to 55,679. In terms of region, the South endured the heaviest level of coming layoffs last month as employees announced 22,818 cuts. There were 17,187 announced layoffs in the West, 10,453 in the Midwest, and 5,221 in the East.
The October reading is the lowest level of monthly announced layoffs in 17 months, so things are moving in the right direction. This is a vital first step. The next step is obviously payroll additions but firms are very likely to squeeze more work out of existing employees before adding jobs. There is a lot of slack out there. Just as we talked about yesterday by way of the factory orders reports, unfilled orders continued to decline and that means the existing workforce is having no problem keeping up with orders. Until existing workers become quite stretched, firms are not going to rush to hire more workers in this environment.
Additionally, small and medium-sized businesses will lead job creation, as is always the case. But these firms are having trouble getting financing as the banking industry remains saddled with poor credit quality and loan defaults. Thus they are preserving their capital positions and holding back from providing the financing to small business. There is nothing terribly unusual about this in general, it is the reality when loan delinquencies rise. But the current environment has seen an abnormally high level of delinquency rates, and that means financing is that much harder to come by for the smalls and mediums.
ADP Employment
U.S. companies eliminated 203,000 in October, according to business outsourcing solutions firm ADP, down from the 227,000 estimated by the firm during September (the official government jobs report showed a loss of 263,000 jobs for that month – we get the official October reading tomorrow). This marks the 21st straight month of job losses. This level of job losses remains in line with pretty heightened level of monthly job losses during the typical recession. We’ve seen the level of losses fall from extreme levels, but they will have to move to the minus 100k-150K level per month before we begin to get excited that firms have moved past this very damaging job slashing phase.
Small and medium firms led the job cuts last month, again not official but according to this survey, as both reduced payrolls by 75,000 a piece. Small firms are defined as those with less than 50 employees and medium firms as those with between 50-499 employees. Large firms shed 53,000 positions.
ISM Non-manufacturing
The Institute for Supply Management reported that the service sector expanded for a second-straight month in October. Although, the pace of expansion eased a bit as ISM non-manufacturing slipped to 50.6 from 50.9 in September. A reading above 50 marks expansion, so you can see service-sector growth is pretty tenuous.
Most of the sub-indices moved in the right direction. Overall business activity picked up to 55.2 from 55.1; new orders rose more than one point to 55.6 from 54.2; backlog of orders rose to 53.5 from 51.5.
However, the measures that are most in sight right now slipped. The inventory measure fell 4.5 points to 43.0 (been in contraction mode for 14 months). The inventory sentiment figure rose to 63.5 from 62.0 (a reading over 50 on this one means that firms view stockpiles are still too high). And the employment gauge fell to 41.1 from 44.3 on September.
Nine of the 18 industries tracked reported expansion, and that is up from five in September.
What respondents were saying:
“Cost-cutting efforts continue.” (Transportation & Warehousing)
“Overall business activity increasing – forecast even better market conditions in the coming months.” (Construction)
“Business climate remains encouraging, but recovery will remain slow in rebounding.” (Professional, Scientific & Technical Services)
“The weakening U.S. dollar contributing to upward pressure on commodity prices.” (Wholesale Trade)
FOMC – ZIRP Lives
The FOMC (rate-setting and policy decision-making committee of the Federal Reserve) kept their statement essentially unchanged from that of the September meeting as the “exceptionally” low level of fed funds for an “extended period” phrases remained. As touched on yesterday, this is a clear signal to all that the banking system remains in a tough spot – credit quality is deteriorating and lending continues to contract. Therefore, the Fed feels the need to continue recapitalizing the banks, the main goal of the zero interest-rate policy (ZIRP), and whatever it can do to juice the housing market.
In terms of these key comments the statement was a carbon copy of the previous meeting’s wording. But there were some changes in other regards:
- The Fed will purchase just $175 billion of agency debt now, versus the $200 billion in the previous plan. (For clarity, they will complete their $1.25 trillion of agency mortgage-backed securities by the end of the first quarter 2010. They’ve completed the $300 billion purchase of Treasury securities.)
- Household spending appears to be expanding. The previous statement said that household spending seems to be stabilizing.
- The Fed stated three conditions that will determine how long they keep policy accommodative: elevated resource slack (a high unemployment rate), subdued inflation trends and stable inflation expectations.
Mainstream economists, in their reaction to the FOMC statement, sang in unison about the Fed’s three stated criteria. As if from a choir, they acted as if this is some new revelation. It is not. Anyone who has paid attention and studied the Fed’s mindset for decades now knows that the unemployment in particular is what the Fed focuses on. Long-time readers know that this has been my main critique of the Fed for several years now. It’s nothing more than the same old Phillips Curve nonsense that has gotten the Fed, and the rest of us, in trouble so many times -- and none greater than their previous policy mistakes (2002-2005 when they kept real rates negative) that led to the housing bubble and the over-leveraged nature of households and institutions.
Many may have suspected it, these latest statements remove any doubt. Bernanke is not going to remove the spike punchbowl for some time. The unemployment rate is a lagging indicator, and so are the traditional measures of inflation. Therefore, they will extend the aggressive accommodation for much longer than is warranted – nothing new there. This means the unwinding of this policy, the tightening, is likely to be severe and harsh. Better to mildly remove the emergency level of fed funds, bringing it 0.75%-1.00%, than to keep things floored like this. If the economy cannot deal with a 1.00% FF, then stocks have gotten ahead of the economic state of things by a larger degree than I have thought.
What Bernanke & Co. needs to focus on is credit expansion. When this begins to kick up, that’s when the money-pumping agenda explodes into inflation. Instead, they just cannot bring themselves to shed the flawed Keynesian models that cause them to make harmful mistakes. This latest FOMC statement does nothing to increase my level of confidence in this Fed.
Have a great day!
Brent Vondera, Senior Analyst
Wednesday, November 4, 2009
P/B ratio
In honor of Warren Buffett’s latest acquisition, I wanted to explain one of his favorite valuation methods: evaluating a company’s price-to-book (P/B) ratio. Broadly speaking, the P/B ratio compares a stock’s market value to its book value to determine whether or not the company is undervalued.
Book value is a company’s assets (cash, inventory, equipment, real estate, etc) minus intangible assets (copyrights, logos, etc) and liabilities (debt, unearned revenue, etc.).
Consider a simple example in which a company has $100 million in assets on the balance sheet and $75 million in liabilities. If there are 10 million shares outstanding, each share would represent $2.50 of book value. If each share sells on the market at $5, then P/B ratio would be 2.
A company may be trading at less than its book value (or have a P/B ratio of 1) for two very different reasons. One reason could be that the market believes the asset value is overvalued or that there is something fundamentally wrong with the company. If this is true, then investors should stay away since a downward correction of that asset value by the market would result in negative returns.
The other possibility is that the company is earning a dismal (maybe even negative) return on its assets. In this case, changes in management or business conditions may prompt a turnaround in prospects and provide strong positive returns. If this turnaround never materializes, then the company could at least be broken up for its asset value and, in turn, provide shareholders with a profit.
Although the P/B ratio is traditionally used by value investors, it’s also useful for investors seeking growth at a reasonable price. Growth companies tend to have higher P/B ratios, which is fine as long as the company has a high return on equity (ROE). Large discrepancies between P/B and ROE should raise a red flag.
So how does Buffett’s recent acquisition of Burlington Northern Santa Fe (BNI) railroad look?
The purchase price of $100 a share gives BNI a P/B of 2.80 and a P/E of 20 times future earnings – not exactly what most would consider a “value.” What this means is that Buffett believes the company’s growth prospects are very attractive once the economy recovers.
Railroads do, in fact, have good operating leverage to an economic recovery since more than half of operating expenses are fixed – increases in rail volume would significantly enhance profit margins. Buffett also has a history of seeking companies with strong competitive advantages such as barriers to entry. The established network of nearly impossible to replace assets provides railroads with staggering barriers to entry.
Acropolis, too, has been buyers of railroads since March; however, we favor Norfolk Southern (NSC) due to its cheaper valuation, impressive profitability, diverse customer base, and commitment to returning value to shareholders. And since we are talking P/B ratios, NSC’s is only 1.82 compared to BNI’s 2.70.
The P/B ratio shouldn’t be the sole reason for making an investment decision. Like all valuation methods, it varies across industries and can be distorted by a company’s accounting methods in their financial statements. Still, the P/B ratio is a nice starting point for finding undervalued companies.
--
Peter J. Lazaroff, Investment Analyst
Daily Insight
U.S. stocks spent most of the session below the flat line on a downgrade of chipmakers and investors seemed content to wait for the end of the Fed’s two-day meeting, but the broad market rallied late in the session to close in positive territory. A couple of merger and acquisition deals helped to offset substantial weakness in pre-market trading that flowed into the official trading session. Stanley Works will purchase Black & Decker and then there is the big one, announced early yesterday morning, which was Berkshire Hathaway’s purchase of the 77% of Burlington Northern it didn’t already own.
Industrial shares led the broad market’s advance, propelled by the two deals. The basic material (certainly helped by a big time rally in the price of gold) and energy sectors were close behind. The losers on the session were health-care, utilities, tech, telecoms and consumer staples – all closed lower on the session.
Berkshire’s all-out purchase of railroad giant Burlington Northern is clearly a bet (since Buffett is an economic advisor to the Obama Administration it was probably much safer than a “bet”) on increased infrastructure spending and future taxes on carbon emissions that make truckers less competitive relative to the rails.
Advancers whipped decliners by a two-to-one margin even though the overall market didn’t really have much juice to it. The advancers surely didn’t advance by much, with the exception of the transports on the Burlington deal. The Dow Jones Transportation Average massively outperformed the market (up 5.28% on the trannies vs. the 0.24% pick up for the broad index).
Market Activity for November 3, 2009
 Gold
Gold
The front-month gold contract rose to a record, spiking $31 to $1085.80 (still well below the 1980 inflation-adjusted price of roughly $2350/oz.) as India’s central bank went on a little buying spree – they purchased 200 tons, or $6.7 billion worth, of gold from the IMF.
Industrial shares led the broad market’s advance, propelled by the two deals. The basic material (certainly helped by a big time rally in the price of gold) and energy sectors were close behind. The losers on the session were health-care, utilities, tech, telecoms and consumer staples – all closed lower on the session.
Berkshire’s all-out purchase of railroad giant Burlington Northern is clearly a bet (since Buffett is an economic advisor to the Obama Administration it was probably much safer than a “bet”) on increased infrastructure spending and future taxes on carbon emissions that make truckers less competitive relative to the rails.
Advancers whipped decliners by a two-to-one margin even though the overall market didn’t really have much juice to it. The advancers surely didn’t advance by much, with the exception of the transports on the Burlington deal. The Dow Jones Transportation Average massively outperformed the market (up 5.28% on the trannies vs. the 0.24% pick up for the broad index).
Market Activity for November 3, 2009
GoldThe front-month gold contract rose to a record, spiking $31 to $1085.80 (still well below the 1980 inflation-adjusted price of roughly $2350/oz.) as India’s central bank went on a little buying spree – they purchased 200 tons, or $6.7 billion worth, of gold from the IMF.
 Bianco Research
Is this a move to diversify away from currencies (namely the U.S. dollar) as the world loses confidence in governments’ ability to stabilize currency values? It seems that way. The purchase boosted India’s gold holdings by 55%. Hey big Ben, it’s kind of difficult to ignore this transaction!
Earnings Season
We haven’t heard a lot about earnings season after the first couple of weeks of results. It’s interesting how the press makes such a big deal in the early stages of the season when just a few companies have reported, and attention tapers off when it really counts -- and it counts now as 80% of S&P 500 members have released results.
Analysts and financial commentators had talked much of the fact that 82% of S&P 500 members have beat expectations, but those were pretty low-ball estimates – firms have low-balled estimates for several years now, but the percentage of positive surprises shows they were really marking things low this go around; the long-term average of S&P 500 members that beat expectations is 59%.
Profit results overall though are quietly eroding, quietly because no one seems to be talking about it. A couple of weeks into the season results were down roughly 8% from the year-ago period. Last week when we touched on profit results, S&P 500 earnings were down 15%. Currently, with most firms now having reported, overall profits are down 22.3% (down 26.6% ex-financials). That’s not much better than the previous quarter’s results in which overall profits fell 28.9% and ex-financial was down 27.9%. And the current results are being compared against easier year-ago period comps than the comparisons for the previous quarter.
FOMC
We’ve got a lot of important data/announcements for the remainder of this week. We have the preliminary jobs reports via the Challenger Layoffs and ADP Employment surveys as we wait for the official October jobs results on Friday. We also have same-store retail sales results for October coming on Thursday. But we also have the latest FOMC (Fed’s rate-setting and monetary policy committee) two-day meeting and the comments that follow the meetings end, which occurs this afternoon.
So we turn to the Fed and the market awaits the comments. It is clear that one expects they’ll increase the benchmark fed funds rate. So, the market will be intensely focused to the wording and clues as to when Bernanke & Co. will shift from their ZIRP “for an extended period” to simply a policy that is just accommodative. That is, shifting from the current emergency level of fed funds to something closer to 1%-2% over the next several months to a year. It’s easy to forget, I guess, as the Fed has kept the pedal to the metal, but 1%-2% FF is still amazing accommodative.
This ZIRP policy that has been in place for almost a full year now, and will have extended beyond a year by the time it is removed, is arguably justified based on the troubled state of the economy but it is also destructive as well. The Fed needs to be very careful not to extend this for too long – besides we need to know if the economy can stand without it. If it can’t manage to grow at 1%-2% FF, then the market has some valuation adjustments to get on with – for sure, the distorting effects of the Fed’s policy needs to end for it will only cause a more severe blowback the longer they wait.
For instance, the ZIRP has devolved the U.S. dollar into a carry trade currency – traders borrow at the exceptionally low U.S. interest rates and invest in higher return vehicles; the occurrence of this is obvious as virtually all asset classes (and even those that are not official asset classes) are moving in the same direction. Stocks, bonds, gold, oil, industrial metals, they are all moving in tandem – a very unusual occurrence. When the Fed does turn course and eventually moves to increase rates (and removes the carry trade) the mad dash for the riskier-asset exit door will ensue and that more than likely means a simultaneous decline among many different asset classes. The longer the Fed waits, the more damaging this run for cover will be on asset prices.
The Fed has backed itself into a corner, and it began with their mistakes all the way back in the 2002-2005 period, which was a primary cause of this entire mess. The longer they remain in the corner, the more head shots the economy will take when they step out. As a result, the Fed meetings, and comments that follow, will become intensely important events.
I’ll tell you this, the Fed is keeping a close eye on the banking industry now and may see the challenges to the financial system as still so great that they feel compelled to keep ZIRP in place. If the members of the FOMC cannot decide to even mildly remove some of this aggressive accommodation, then that should be a crystal clear signal to all that they see loan portfolios are continuing to erode at an alarming rate. What else would justify this emergency level of rates and the consequences that follow?
Factory Orders
The Commerce Department reported that factory orders rose a healthy 0.9% in September, slightly more than expected, after a 0.8% decline in August. Bookings for durable goods orders (which currently make up half of factory orders) jumped 1.4% after a 2.7% decline in August. Machinery orders fueled the gain in durables as mining, construction and power transmission companies ordered new equipment. Bookings for non-durable goods (such as food, petroleum, clothing, paper products, etc.) rose 0.5% in September. Food, petro and paints and coating (autos) led non-durable shipments higher. Beverage & tobacco, apparel and paper products dragged on non-durables.
The proxy for business-equipment spending rose 1.8%, after a 1.0% decline in August; the figure has been absolutely crushed over the past year, down 16% -- although an improvement from the year-over-year 21% decline as of August.
Unfilled orders fell for a 12th straight month (longest stretch of decline since records began in 1992), down 0.3% in September, which shows factories (even with much lower payroll levels) are having no problem meeting orders.
Inventories fell for a 13th straight month, down 1.0% for the month. The inventory-to-shipments ratio fell for a fourth straight month to 1.36 (from 1.38) but remains well-above the record low of 1.13 hit in December 2005.
 The gain in factory orders marks the fifth increase in six months. From here we will see if it is sustainable, it will all depend on the timeline with which final demand arrives. If it is lacking, due to a persistently high jobless rate, we won’t get that full-blown inventory dynamic we’ve been waiting for and that will show up in the production numbers.
October Auto Sales
Late in the day yesterday we got the October auto sales figures, which bounced a bit from September’s very weak 9.20 million units. Vehicle sales rose to 10.45 million at an seasonally-adjusted annual rate (SAAR).

Have a great day!
Brent Vondera, Senior Analyst
Tuesday, November 3, 2009
Afternoon Review: Buffett, Transports, Semiconductors
S&P 500: +2.53 (+0.24%)
Markets swung between gains and losses before ending higher. Helping push stocks higher was the fact that the dollar pared early gains. The dollar’s losses also resulted in crude oil bumping up to just under the $80 level.
Traders’ may be hesitating to push stocks into positive territory as they await several economic releases later in the week including the monetary policy announcement from the Fed tomorrow, and the labor report on Friday – both items could potentially give investors a better view of the pace of ht economic recovery.
Berkshire Hathaway’s acquisition of Burlington Northern Santa Fe was the top story of the day, pushing railroad companies and other transportation stocks higher. Berkshire’s Chairman and CEO Warren Buffett paid a 30% premium for the railroad.
Believers in the Dow Theory may make a bullish argument following today’s upward action in the Dow Jones Transportation Index. The Dow Theory says that transportation companies move what industrials are making and, thus, serve as a good leading indicator. Others, however, argue that semiconductors are better indicators of future market direction.
Within the technology universe, economically sensitive semiconductors tend to lead the pack. Just as some technicians watch the Dow Jones Transportation Index for indications of future market movements, others refer to the Philadelphia Semiconductor Index (SOX). The SOX has slipped this week on unfavorable research notes from Morgan Stanley and Goldman Sachs, both of which citing higher expectations following strong third-quarter earnings and, thus, greater downside risk.
--
Peter J. Lazaroff, Investment Analyst
Markets swung between gains and losses before ending higher. Helping push stocks higher was the fact that the dollar pared early gains. The dollar’s losses also resulted in crude oil bumping up to just under the $80 level.
Traders’ may be hesitating to push stocks into positive territory as they await several economic releases later in the week including the monetary policy announcement from the Fed tomorrow, and the labor report on Friday – both items could potentially give investors a better view of the pace of ht economic recovery.
Berkshire Hathaway’s acquisition of Burlington Northern Santa Fe was the top story of the day, pushing railroad companies and other transportation stocks higher. Berkshire’s Chairman and CEO Warren Buffett paid a 30% premium for the railroad.
Believers in the Dow Theory may make a bullish argument following today’s upward action in the Dow Jones Transportation Index. The Dow Theory says that transportation companies move what industrials are making and, thus, serve as a good leading indicator. Others, however, argue that semiconductors are better indicators of future market direction.
Within the technology universe, economically sensitive semiconductors tend to lead the pack. Just as some technicians watch the Dow Jones Transportation Index for indications of future market movements, others refer to the Philadelphia Semiconductor Index (SOX). The SOX has slipped this week on unfavorable research notes from Morgan Stanley and Goldman Sachs, both of which citing higher expectations following strong third-quarter earnings and, thus, greater downside risk.
--
Peter J. Lazaroff, Investment Analyst
Daily Insight
U.S. stocks were sent on a wild ride Monday as the day’s economic data spurred a strong morning-session rally, only to see it fizzle after some reality-based comments from a Federal Reserve official scared the market out of it easy-money stupor. The market later rallied to recoup nearly half of the early-session gains.
The sell-off, which completely erased a 1.5% rally from the get go, seemed to follow a statement from the associate director of the Fed’s bank supervision division that banking system conditions remain “far from robust” and examiners have noticed “sharp deterioration” in loan portfolios. He explicitly stated problems the Fed is seeing in commercial real estate loans but also seemed to show concern regarding corporate loan portfolios as well. We’ll touch on some statements on bank regulation and commercial real estate below.
 In the end consumer staples, basic material, and industrial shares led the gains. Utilities and telecoms were the losers as the only two of the 10 major industry groups that failed to end on the plus side. Financials were whipsawed, down as much as 4.2% from their day’s peak but ended up closing just 1.6% below the session’s apex – the group closed the session higher by roughly 0.8%.
Ten stocks rose for very seven that declined on the NYSE. Some 1.5 billion shares traded on the NYSE Composite, 16% higher than the six-month average.
Market Activity for November 2, 2009
 Banking Industry Issues – and That Means Economic Issues
The WSJ reported on Saturday that regulators have issued guidelines that allow banks to term commercial real estate loans as “performing” even when the underlying property values have fallen below the loan amount. This is not a reversal of existing rules, but does provide more clarity as banks struggle to deal with the erosion in commercial RE assets.
This increased clarity is not that all that much different from the change to mark-to-market (specifically FASB 157) accounting that offered greater lucidity (at the time with regard to troubled residential loans) and stopped the regulation from artificially destroying capital positions within the banking system. If banks are going to hold assets (a loan) to maturity, so long as the interest and principal payments are current, why write them down to distressed prices and destroy capital? It would only cause additional economic harm – and indeed it did.
But also recall, before that I was conspicuously in favor of the original TARP. That program would have used an RTC-style structure to remove bad assets from banks’ books and placed them in an account that the government would run -- hold assets for 5-10 years, however long it takes, until the RE market normalizes and sell them off. Regulators can provide increased levels of clarity, and that is helpful, but it doesn’t change the fact that banks still carry a lot of troubled loans on their books.
This was Bill Seidman’s Resolution Trust Corp. back in the very early 1990s that proved so successful, it made a profit for the government, and that is the point – doing what history has shown to work. Unfortunately, TARP was changed to this idiot idea of injecting government money into the banking system – we expressed a steadfast objection to this move back in the winter of 2008. It was changed because the original TARP plan was seen as too plodding, but it may very well have been up and running by now – if so, we may just be on the road to a somewhat more normal environment.
The overall reality though is that commercial RE defaults are a ticking bomb for a large portion of the banking system that the market seems to be ignoring – a lot of risks have been ignored of late but this is what an easy-money/ZIRP does, it distorts markets. The larger issue now is that without an RTC-style program banks will be saddled with bad assets for some time to come and that means little to no credit expansion. In the world of intense government intervention we currently find ourselves, an RTC-style solution would have been much less damaging than many of the things we have tried (and continue to try).
We are in a nasty situation here and the investor needs to come to grips with the reality on the ground, you just can’t casually move out along the risk curve as if this were a normal business-cycle expansion, or a typical political environment.
ISM Manufacturing
The Institute for Supply Management’s manufacturing index rose to 55.7 in October (highest since April 2006), up nicely from 52.6 printed in September – the reading blew by the expectation of 53.0.
 This move in ISM marks the third month of expansion and the October reading is fairly robust (for this environment); it mirrors the 55 print out of China the night before.
Most of the sub-indices looked good as new orders, backlog of orders, supplier deliveries and export orders remained in expansion mode. However, all of these but export orders showed a slower pace of expansion relative to the September readings.
 The best news of the report was the rise in the employment figure – up to 53.1 from 46.2, the first month of expansion since July 2008 (probably some callbacks thanks to increased auto assemblies). This area was a big concern on Friday when the Chicago manufacturing’s employment figure remained pretty deep in contraction territory. Eight of the 18 industries tracked by ISM reported employment growth, up from three in September.
 The inventory figures have been another area of concern as the data has yet to show an actual rebuilding of stockpiles is taking place. ISM’s inventory figure bounced in October, but it does remain in contraction mode, up to 46.9 from 42.5 – the trend is really nice though. The customer inventories reading (what respondents to the ISM survey think of their customers’ inventories levels) fell 0.5 to 38.5. This means they think their customers’ stockpile levels are too low, so after seven months now of this reading being below 50 maybe this is a sign some inventory rebuilding may ensue over the next couple of months. Conversely, it also shows that businesses have little confidence regarding future sales.
 Overall, it was a good report and certainly the best we’ve seen (from an all-around perspective) since the summer of 2007. Thirteen of the 18 industries tracked reported growth, unchanged from September.
Pending Home Sales
The National Association of Realtors reported that September pending home sales jumped 6.1% from the previous month – the reading was expected to come in unchanged. This large increase in contract signings was undoubtedly due to the rush to get in before the first-time homebuyers’ tax credit expires (have to close before November 30, and it’s taking 6-8 weeks to close). The October data will likely mark an end to this strong six-month run that was driven by a powerful trifecta – the tax credit, the home buying season and Fed-induced rock bottom interest rates. Of course, September home buyers didn’t know the credit was going to be extended, which is highly likely now.
In terms of region, the West led the way as pending home sales jumped 10.2% -- a sign foreclosure-driven price declines also fueled the September increase. The Midwest posted the second-best increase, up 8.1%, with the South printing a 4.9% rise. Contract signings fell 2.0% in the Northeast.
In terms of the tax credit’s extension, the number we keep hearing is April 30 (or contract closed 60 days after that date). At some point though the credits must come to an end and that is when we’ll learn the true status of the housing market. As mentioned above, this is just another government scheme that distorts the true market fundamentals.
Construction Spending
Construction spending rose 0.8% in September, fueled by a 3.9% jump in residential construction. I can see this becoming quite the problem when home sales wane as the supply figure will jump again.
The commercial side declined for a fifth-straight month, down 13.7% at an annual rate over the past three months. The public side has helped to offset the plunge in private-sector commercial construction (private sector down 26.8% annualized over the past three months and getting worse, public sector commercial construction up 5.3% on the same basis).
Futures
Stock-index futures are down big this morning as the safety trade makes a bit of a comeback. However, pre-market trading has pared some of those losses on news that Berkshire Hathaway, the investment vehicle for Warren Buffett, will purchase the 77% of Burlington Northern (railroad) that is doesn’t already own in a cash and stock deal. The deal is $100/share, or a 30% premium to yesterday’s closing price.
Have a great day!
Brent Vondera, Senior Analyst
The sell-off, which completely erased a 1.5% rally from the get go, seemed to follow a statement from the associate director of the Fed’s bank supervision division that banking system conditions remain “far from robust” and examiners have noticed “sharp deterioration” in loan portfolios. He explicitly stated problems the Fed is seeing in commercial real estate loans but also seemed to show concern regarding corporate loan portfolios as well. We’ll touch on some statements on bank regulation and commercial real estate below.
In the end consumer staples, basic material, and industrial shares led the gains. Utilities and telecoms were the losers as the only two of the 10 major industry groups that failed to end on the plus side. Financials were whipsawed, down as much as 4.2% from their day’s peak but ended up closing just 1.6% below the session’s apex – the group closed the session higher by roughly 0.8%.Ten stocks rose for very seven that declined on the NYSE. Some 1.5 billion shares traded on the NYSE Composite, 16% higher than the six-month average.
Market Activity for November 2, 2009
Banking Industry Issues – and That Means Economic IssuesThe WSJ reported on Saturday that regulators have issued guidelines that allow banks to term commercial real estate loans as “performing” even when the underlying property values have fallen below the loan amount. This is not a reversal of existing rules, but does provide more clarity as banks struggle to deal with the erosion in commercial RE assets.
This increased clarity is not that all that much different from the change to mark-to-market (specifically FASB 157) accounting that offered greater lucidity (at the time with regard to troubled residential loans) and stopped the regulation from artificially destroying capital positions within the banking system. If banks are going to hold assets (a loan) to maturity, so long as the interest and principal payments are current, why write them down to distressed prices and destroy capital? It would only cause additional economic harm – and indeed it did.
But also recall, before that I was conspicuously in favor of the original TARP. That program would have used an RTC-style structure to remove bad assets from banks’ books and placed them in an account that the government would run -- hold assets for 5-10 years, however long it takes, until the RE market normalizes and sell them off. Regulators can provide increased levels of clarity, and that is helpful, but it doesn’t change the fact that banks still carry a lot of troubled loans on their books.
This was Bill Seidman’s Resolution Trust Corp. back in the very early 1990s that proved so successful, it made a profit for the government, and that is the point – doing what history has shown to work. Unfortunately, TARP was changed to this idiot idea of injecting government money into the banking system – we expressed a steadfast objection to this move back in the winter of 2008. It was changed because the original TARP plan was seen as too plodding, but it may very well have been up and running by now – if so, we may just be on the road to a somewhat more normal environment.
The overall reality though is that commercial RE defaults are a ticking bomb for a large portion of the banking system that the market seems to be ignoring – a lot of risks have been ignored of late but this is what an easy-money/ZIRP does, it distorts markets. The larger issue now is that without an RTC-style program banks will be saddled with bad assets for some time to come and that means little to no credit expansion. In the world of intense government intervention we currently find ourselves, an RTC-style solution would have been much less damaging than many of the things we have tried (and continue to try).
We are in a nasty situation here and the investor needs to come to grips with the reality on the ground, you just can’t casually move out along the risk curve as if this were a normal business-cycle expansion, or a typical political environment.
ISM Manufacturing
The Institute for Supply Management’s manufacturing index rose to 55.7 in October (highest since April 2006), up nicely from 52.6 printed in September – the reading blew by the expectation of 53.0.
This move in ISM marks the third month of expansion and the October reading is fairly robust (for this environment); it mirrors the 55 print out of China the night before.Most of the sub-indices looked good as new orders, backlog of orders, supplier deliveries and export orders remained in expansion mode. However, all of these but export orders showed a slower pace of expansion relative to the September readings.
The best news of the report was the rise in the employment figure – up to 53.1 from 46.2, the first month of expansion since July 2008 (probably some callbacks thanks to increased auto assemblies). This area was a big concern on Friday when the Chicago manufacturing’s employment figure remained pretty deep in contraction territory. Eight of the 18 industries tracked by ISM reported employment growth, up from three in September.The inventory figures have been another area of concern as the data has yet to show an actual rebuilding of stockpiles is taking place. ISM’s inventory figure bounced in October, but it does remain in contraction mode, up to 46.9 from 42.5 – the trend is really nice though. The customer inventories reading (what respondents to the ISM survey think of their customers’ inventories levels) fell 0.5 to 38.5. This means they think their customers’ stockpile levels are too low, so after seven months now of this reading being below 50 maybe this is a sign some inventory rebuilding may ensue over the next couple of months. Conversely, it also shows that businesses have little confidence regarding future sales.Overall, it was a good report and certainly the best we’ve seen (from an all-around perspective) since the summer of 2007. Thirteen of the 18 industries tracked reported growth, unchanged from September.Pending Home Sales
The National Association of Realtors reported that September pending home sales jumped 6.1% from the previous month – the reading was expected to come in unchanged. This large increase in contract signings was undoubtedly due to the rush to get in before the first-time homebuyers’ tax credit expires (have to close before November 30, and it’s taking 6-8 weeks to close). The October data will likely mark an end to this strong six-month run that was driven by a powerful trifecta – the tax credit, the home buying season and Fed-induced rock bottom interest rates. Of course, September home buyers didn’t know the credit was going to be extended, which is highly likely now.
In terms of region, the West led the way as pending home sales jumped 10.2% -- a sign foreclosure-driven price declines also fueled the September increase. The Midwest posted the second-best increase, up 8.1%, with the South printing a 4.9% rise. Contract signings fell 2.0% in the Northeast.
In terms of the tax credit’s extension, the number we keep hearing is April 30 (or contract closed 60 days after that date). At some point though the credits must come to an end and that is when we’ll learn the true status of the housing market. As mentioned above, this is just another government scheme that distorts the true market fundamentals.
Construction Spending
Construction spending rose 0.8% in September, fueled by a 3.9% jump in residential construction. I can see this becoming quite the problem when home sales wane as the supply figure will jump again.
The commercial side declined for a fifth-straight month, down 13.7% at an annual rate over the past three months. The public side has helped to offset the plunge in private-sector commercial construction (private sector down 26.8% annualized over the past three months and getting worse, public sector commercial construction up 5.3% on the same basis).
Futures
Stock-index futures are down big this morning as the safety trade makes a bit of a comeback. However, pre-market trading has pared some of those losses on news that Berkshire Hathaway, the investment vehicle for Warren Buffett, will purchase the 77% of Burlington Northern (railroad) that is doesn’t already own in a cash and stock deal. The deal is $100/share, or a 30% premium to yesterday’s closing price.
Have a great day!
Brent Vondera, Senior Analyst
Monday, November 2, 2009
October 2009 Recap
*Please contact for full monthly report.
The S&P 500 snapped its streak of seven consecutive monthly gains as investors grappled with the sustainability of the global economic recovery. The higher-than-expected report on third quarter GDP confirmed that the economy is recovering as did the Index of Leading Economic Indicators, which beat estimates by rising 1% in September and marking the sixth straight month of gains.
Too, earnings season helped confirm the recovery is taking hold. Management commentary has been cautiously optimistic, with many companies suggesting the worst is behind us, but warning the recovery remains bumpy. The reaction to positive earnings has been more muted than in the previous quarter since revenue results failed to impress. Investors had been looking for revenue growth, rather than cost-cutting, to boost profits.
Investor enthusiasm surrounding an improvement in the economy had pushed stocks to 2009 highs early in the month, but all that evaporated as the month came to a close. On cue, the VIX Index, also known as the market’s “fear gauge,” jumped to its highest level in nearly four months, moving above 30 near the month’s end. In addition to the sustainability of the economic recovery, investor concerns include the removal of massive fiscal and monetary stimulus, the weak U.S. consumer, the actual and proposed government spending, and the weak U.S. dollar.
The relationship between the dollar and stocks was incredibly tight throughout the month, with days of dollar strength causing stocks to fall and vice versa. Other asset classes such as gold and energy prices were also closely correlated with the dollar.
The riskiest investments were the month’s worst performers, a reversal from the last seven months. Smaller capitalization stocks trailed their larger counterparts, while Financials and Materials sectors were the worst performing sectors in the S&P 500.
Energy was the top performing sector, with a weaker U.S. dollar pushing up prices of fuels such as oil, natural gas, and coal. The only other sector to finish in the black was Consumer Staples, which benefited from cheap valuations relative to the rest of the market as well as its defensive nature.
--
Peter J. Lazaroff, Investment Analyst
The S&P 500 snapped its streak of seven consecutive monthly gains as investors grappled with the sustainability of the global economic recovery. The higher-than-expected report on third quarter GDP confirmed that the economy is recovering as did the Index of Leading Economic Indicators, which beat estimates by rising 1% in September and marking the sixth straight month of gains.
Too, earnings season helped confirm the recovery is taking hold. Management commentary has been cautiously optimistic, with many companies suggesting the worst is behind us, but warning the recovery remains bumpy. The reaction to positive earnings has been more muted than in the previous quarter since revenue results failed to impress. Investors had been looking for revenue growth, rather than cost-cutting, to boost profits.
Investor enthusiasm surrounding an improvement in the economy had pushed stocks to 2009 highs early in the month, but all that evaporated as the month came to a close. On cue, the VIX Index, also known as the market’s “fear gauge,” jumped to its highest level in nearly four months, moving above 30 near the month’s end. In addition to the sustainability of the economic recovery, investor concerns include the removal of massive fiscal and monetary stimulus, the weak U.S. consumer, the actual and proposed government spending, and the weak U.S. dollar.
The relationship between the dollar and stocks was incredibly tight throughout the month, with days of dollar strength causing stocks to fall and vice versa. Other asset classes such as gold and energy prices were also closely correlated with the dollar.
The riskiest investments were the month’s worst performers, a reversal from the last seven months. Smaller capitalization stocks trailed their larger counterparts, while Financials and Materials sectors were the worst performing sectors in the S&P 500.
Energy was the top performing sector, with a weaker U.S. dollar pushing up prices of fuels such as oil, natural gas, and coal. The only other sector to finish in the black was Consumer Staples, which benefited from cheap valuations relative to the rest of the market as well as its defensive nature.
--
Peter J. Lazaroff, Investment Analyst
Daily Insight
U.S. stocks fell on Friday, the biggest one-day hit in about four months, as a drop in consumer spending for September (this should have been expected) and the employment gauge in the latest manufacturing survey both increased concerns that stocks have gotten ahead of realties on the ground.
Of course, we’ll just have to wait and see if this is simply a correction phase after the significant rally from the March depths or something more serious. There is little doubt the economic picture remains quite troubling, especially with regard to the banking industry’s woes and the ramifications this has on economic growth over the next 12-18 months.
The sectors that have led this rally got smoked on Friday as financials lost 4.75%, basic materials slid 3.82% and energy fell 3.49%.
We’ve seen a lot of people talk about the reflation trade, commodity and energy stocks, but these groups are likely to pull back meaningfully before rising again. These areas were places investors should have been looking to get into back in March, but not after their huge run from those late-winter lows. This is one reason I’ve ripped on the bandwagon tendencies of Wall Street. There’s been a lot of “strong buy” recommendations on the commodity stocks lately, a dangerous thought for those looking to make a quick buck – basic materials soared 80% from their lows before this latest reversal.
The broad market ended the month down 1.98%, the first monthly decline in eight months. However, on a 12-month rolling return basis, the S&P 500 marked its first positive return in 22 months.
Market Activity for October 30, 2009
 Personal Income and Spending
The Commerce Department reported that personal income was flat in September, as another strong month for rental income and an outsized rise (from historical average not in terms of this new larger government world we now live in) in government transfer payments offset declines in the most important segments – compensation and wage & salary.
In terms of those segments, compensation fell 0.1% in September (down 4.3% y/o/y); wage & salary fell 0.2% (down 5.2% y/o/y); proprietor’s income rose 0.1% (down 6.3% y/o/y); rental income rose 1.9% (up a large 24.2% y/o/y); interest income down 0.6% (down 8.3% y/o/y ); dividend income down 1.3% (smashed by 25.4% y/o/y); and transfer payments – out of your pocket and into others’ – rose 0.8% (up 13.5% y/o/y).
So, we continue to see incomes in general continue to erode, without the $17.3 billion in transfer payments personal income would have been down about 0.2% last month. But this is no surprise as the very weak labor market means that the two most important segments of this data (compensation and wage/salary) are going down. So not to totally disrespect the retired, of course interest income is an important number also, you can thank the Fed’s ZIRP for much of this erosion.
On the spending side, consumption fell 0.5% in September after the “cash for clunkers” (CFC) and back-to-school/sales tax holiday induced jump of 1.3% in August.
Spending on durables got clocked, down 7% last month after CFC boosted the figure by 6.1% in August. Funny though, the decline in September completely erases the August gain and puts the durable spending figure below that seen in July. So as we’ve been talking about the clunker cash scheme was completely a one-and-done event.
Spending on non-durables was solid though, up 0.7% in September after the BTS/sales tax holiday induced 2.2% jump in August.
The saving rate increased to 3.3% from 2.8% in August. I love this one. Policy makers are doing everything they can to make sure this figure doesn’t rise above 4% as they keep coming up with schemes to keep people spending. The cash savings rate moved to 4.0% early in the year and hit 5.9% in May before the government came up with the clunker cash program that pushed it back down.
 But all we’re doing is delaying what needs to occur. Households need to boost cash savings as stock and home prices have been pounded (stocks down 30% from the peak and homes down 25%). The cash savings rate needs to go to 6%-8% and stick there before consumer spending can trend higher in a sustained manner.
Via Thursday’s GDP report we see consumer spending rose to a post-WWII high of 71% of GDP. This figure needs to, and will, move back to the historic average of 65% of GDP, particularly due to high unemployment. When the bill for this spending comes due (higher tax rates) and the Fed must eventually unwind its unprecedented monetary easing experiment (higher interest rates) consumer spending will move back down to that historic average and the hit to economic growth will be felt as a result. I do not enjoy effusing this negative tone, but it is the reality of things; wishful thinking has no place in the world in which we currently live.
Chicago PMI
The Chicago Purchasing Managers Index printed a blowout number (for this environment) with several of the sub-indices up big; however, the employment figure declined ans remains in deep contraction mode. Maybe this is why stocks sold off even as the headline figure was strong.
The reading for the most important regional factory survey came in at 54.2 for October (highest since September 2008 – significant date, credit meltdown began) , which easily beat the forecast of 49. The September reading was 46.1.
 The new orders index jumped to 61.4 from 46.3; order backlog rose to 41.9 from 36.7; delivery times 50.7 from 49.3; inventories remain in the dirt, falling another seven points to 32.2. Nevertheless, if October’s strength in new orders continues it will signal a good pace of inventory rebuilding will ensue. But it will take a solid new orders trend.
 The number of employees figure dipped to remain at low level of 38.3. Unfortunately, Chicago PMI does not offer an average workweek (hours worked per week) reading. This is a key number to watch for the factory sector in general as firms will squeeze every bit they can out of the existing workforce before adding to payrolls.
 The market will be intensely focused on the employment figure in today’s ISM reading (nationwide manufacturing survey) as economists attempt to gauge the October jobs report for signs at to whether the pace of job losses trend lower or remain at past recessionary levels.
Futures
U.S. stock-index futures are higher this morning on strong, and trending higher, PMI (Purchasing Managers Index) out of China. China’s huge and infrastructure-focused stimulus is boosting manufacturing activity in the country. Their $586 billion stimulus amounts to 18% of GDP. For an equivalent here in the U.S. we’d have to triple our $787 billion fiscal stimulus.
The Chinese government has also directed banks to lend. Credit expansion has doubled in the past six months and this is also boosting activity. But can it last? The global economic environment does not seem to be self-supporting. Even China’s Commerce Minister warned that the global economy may “plunge” if nations withdraw support measures.
And speaking of support, Ford’s earnings results are just out and the automaker posted its first profit in North America since the first quarter of 2005. A lot of this was due to cost cutting, but clunker cash was another factor. Thanks Uncle Sugar!
Have a great day!
Brent Vondera, Senior Analyst
Of course, we’ll just have to wait and see if this is simply a correction phase after the significant rally from the March depths or something more serious. There is little doubt the economic picture remains quite troubling, especially with regard to the banking industry’s woes and the ramifications this has on economic growth over the next 12-18 months.
The sectors that have led this rally got smoked on Friday as financials lost 4.75%, basic materials slid 3.82% and energy fell 3.49%.
We’ve seen a lot of people talk about the reflation trade, commodity and energy stocks, but these groups are likely to pull back meaningfully before rising again. These areas were places investors should have been looking to get into back in March, but not after their huge run from those late-winter lows. This is one reason I’ve ripped on the bandwagon tendencies of Wall Street. There’s been a lot of “strong buy” recommendations on the commodity stocks lately, a dangerous thought for those looking to make a quick buck – basic materials soared 80% from their lows before this latest reversal.
The broad market ended the month down 1.98%, the first monthly decline in eight months. However, on a 12-month rolling return basis, the S&P 500 marked its first positive return in 22 months.
Market Activity for October 30, 2009
Personal Income and SpendingThe Commerce Department reported that personal income was flat in September, as another strong month for rental income and an outsized rise (from historical average not in terms of this new larger government world we now live in) in government transfer payments offset declines in the most important segments – compensation and wage & salary.
In terms of those segments, compensation fell 0.1% in September (down 4.3% y/o/y); wage & salary fell 0.2% (down 5.2% y/o/y); proprietor’s income rose 0.1% (down 6.3% y/o/y); rental income rose 1.9% (up a large 24.2% y/o/y); interest income down 0.6% (down 8.3% y/o/y ); dividend income down 1.3% (smashed by 25.4% y/o/y); and transfer payments – out of your pocket and into others’ – rose 0.8% (up 13.5% y/o/y).
So, we continue to see incomes in general continue to erode, without the $17.3 billion in transfer payments personal income would have been down about 0.2% last month. But this is no surprise as the very weak labor market means that the two most important segments of this data (compensation and wage/salary) are going down. So not to totally disrespect the retired, of course interest income is an important number also, you can thank the Fed’s ZIRP for much of this erosion.
On the spending side, consumption fell 0.5% in September after the “cash for clunkers” (CFC) and back-to-school/sales tax holiday induced jump of 1.3% in August.
Spending on durables got clocked, down 7% last month after CFC boosted the figure by 6.1% in August. Funny though, the decline in September completely erases the August gain and puts the durable spending figure below that seen in July. So as we’ve been talking about the clunker cash scheme was completely a one-and-done event.
Spending on non-durables was solid though, up 0.7% in September after the BTS/sales tax holiday induced 2.2% jump in August.
The saving rate increased to 3.3% from 2.8% in August. I love this one. Policy makers are doing everything they can to make sure this figure doesn’t rise above 4% as they keep coming up with schemes to keep people spending. The cash savings rate moved to 4.0% early in the year and hit 5.9% in May before the government came up with the clunker cash program that pushed it back down.
But all we’re doing is delaying what needs to occur. Households need to boost cash savings as stock and home prices have been pounded (stocks down 30% from the peak and homes down 25%). The cash savings rate needs to go to 6%-8% and stick there before consumer spending can trend higher in a sustained manner.Via Thursday’s GDP report we see consumer spending rose to a post-WWII high of 71% of GDP. This figure needs to, and will, move back to the historic average of 65% of GDP, particularly due to high unemployment. When the bill for this spending comes due (higher tax rates) and the Fed must eventually unwind its unprecedented monetary easing experiment (higher interest rates) consumer spending will move back down to that historic average and the hit to economic growth will be felt as a result. I do not enjoy effusing this negative tone, but it is the reality of things; wishful thinking has no place in the world in which we currently live.
Chicago PMI
The Chicago Purchasing Managers Index printed a blowout number (for this environment) with several of the sub-indices up big; however, the employment figure declined ans remains in deep contraction mode. Maybe this is why stocks sold off even as the headline figure was strong.
The reading for the most important regional factory survey came in at 54.2 for October (highest since September 2008 – significant date, credit meltdown began) , which easily beat the forecast of 49. The September reading was 46.1.
The new orders index jumped to 61.4 from 46.3; order backlog rose to 41.9 from 36.7; delivery times 50.7 from 49.3; inventories remain in the dirt, falling another seven points to 32.2. Nevertheless, if October’s strength in new orders continues it will signal a good pace of inventory rebuilding will ensue. But it will take a solid new orders trend.The number of employees figure dipped to remain at low level of 38.3. Unfortunately, Chicago PMI does not offer an average workweek (hours worked per week) reading. This is a key number to watch for the factory sector in general as firms will squeeze every bit they can out of the existing workforce before adding to payrolls.The market will be intensely focused on the employment figure in today’s ISM reading (nationwide manufacturing survey) as economists attempt to gauge the October jobs report for signs at to whether the pace of job losses trend lower or remain at past recessionary levels.Futures
U.S. stock-index futures are higher this morning on strong, and trending higher, PMI (Purchasing Managers Index) out of China. China’s huge and infrastructure-focused stimulus is boosting manufacturing activity in the country. Their $586 billion stimulus amounts to 18% of GDP. For an equivalent here in the U.S. we’d have to triple our $787 billion fiscal stimulus.
The Chinese government has also directed banks to lend. Credit expansion has doubled in the past six months and this is also boosting activity. But can it last? The global economic environment does not seem to be self-supporting. Even China’s Commerce Minister warned that the global economy may “plunge” if nations withdraw support measures.
And speaking of support, Ford’s earnings results are just out and the automaker posted its first profit in North America since the first quarter of 2005. A lot of this was due to cost cutting, but clunker cash was another factor. Thanks Uncle Sugar!
Have a great day!
Brent Vondera, Senior Analyst
Friday, October 30, 2009
Fixed Income Weekly
Treasury Market Happenings
This past week was a memorable one for the Treasury market that saw yet another record amount of paper coming to the street in addition to the long awaited end of the Fed’s $300 billion Treasury purchases program.
The supply started on Monday with a $7 billion reopening of the current 5 year TIPS benchmark, that was pretty uneventful. Despite a slew of deflationary factors in the market, inflation protection is in pretty serious demand. The bid/cover ratio was over 3 for the first time since the first 5-year TIPS auction in 1997.
Demand for new paper this week peaked on Tuesday as a record $44 billion in new two-year notes were auctioned with a bid/cover of 3.63 versus a 6 month average of 3.07. This is unbelievable to me. In one day the U.S. Treasury sold debt equal to the size of the GDP of The Dominican Republic, and there was still a line of unfilled buyers out the door. A shift in the source of demand really stood out as domestic investors dominated the auction for the short duration bonds. U.S direct buyers took 26.1% of the auction versus an average of 5.7%. Indirect bidding (or foreign demand) typically takes the largest slice of short term auctions, given the bias foreign central banks have toward the shorter end.
The $41 billion 5-year auction on Wednesday saw demand come back down to more normal levels, and although demand continued to wane on Thursday with the $31 billion seven-year auction, the week was an overall win for the Treasury considering the $123 billion total weekly supply.
The Treasury securities portion of the Fed’s QE also ended on Thursday. As you all are well aware of short term rates are extremely low, and Tuesday’s especially strong two-year auction is good evidence of how far we are from a significant shift in policy that will eventually move the short end, but as we lose a major buyer of intermediate term bonds the longer portion of the curve remains a concern for the market. The housing market is depending heavily on low intermediate term rates, and as the homebuyer credit is slowly phased out, which seems to be likely, low mortgage rates will be the only crutch for credit demand to stand on. The big question now is, “Was the Fed that crutch?”
Housing Market
This past week was a memorable one for the Treasury market that saw yet another record amount of paper coming to the street in addition to the long awaited end of the Fed’s $300 billion Treasury purchases program.
The supply started on Monday with a $7 billion reopening of the current 5 year TIPS benchmark, that was pretty uneventful. Despite a slew of deflationary factors in the market, inflation protection is in pretty serious demand. The bid/cover ratio was over 3 for the first time since the first 5-year TIPS auction in 1997.
Demand for new paper this week peaked on Tuesday as a record $44 billion in new two-year notes were auctioned with a bid/cover of 3.63 versus a 6 month average of 3.07. This is unbelievable to me. In one day the U.S. Treasury sold debt equal to the size of the GDP of The Dominican Republic, and there was still a line of unfilled buyers out the door. A shift in the source of demand really stood out as domestic investors dominated the auction for the short duration bonds. U.S direct buyers took 26.1% of the auction versus an average of 5.7%. Indirect bidding (or foreign demand) typically takes the largest slice of short term auctions, given the bias foreign central banks have toward the shorter end.
The $41 billion 5-year auction on Wednesday saw demand come back down to more normal levels, and although demand continued to wane on Thursday with the $31 billion seven-year auction, the week was an overall win for the Treasury considering the $123 billion total weekly supply.
The Treasury securities portion of the Fed’s QE also ended on Thursday. As you all are well aware of short term rates are extremely low, and Tuesday’s especially strong two-year auction is good evidence of how far we are from a significant shift in policy that will eventually move the short end, but as we lose a major buyer of intermediate term bonds the longer portion of the curve remains a concern for the market. The housing market is depending heavily on low intermediate term rates, and as the homebuyer credit is slowly phased out, which seems to be likely, low mortgage rates will be the only crutch for credit demand to stand on. The big question now is, “Was the Fed that crutch?”
Housing Market
This week I stumbled upon the graph below from the San Francisco Fed showing the rise and fall of non-agency mortgage backed securitization over the past decade. The graph below shows the distribution of market share of new mortgage origination since 2000.

Source: San Francisco Fed
http://www.frbsf.org/publications/economics/letter/2009/el2009-33.html
Some excerpts from the report:
· According to Federal Reserve flow of funds data, the banking institution share of total mortgage assets declined from a peak of about 75% in the mid-1970s to about 35% in 2008. Much of the decline in banking institution housing portfolios over this period was related to the expansion of the government-sponsored enterprises (GSEs) Fannie Mae, Freddie Mac, and Ginnie Mae.
· At its peak in late 2007, non-agency securitizations accounted for nearly 20% of outstanding mortgage credit.
· Non-agency securitizations were much more likely to involve adjustable-rate mortgages, including option ARMs, to be rated as subprime, and to have less-than-full documentation of borrower income and assets.
· In the fourth quarter of 2006, approximately 10% of originations in our sample were labeled by originators as "subprime." For the entire universe of mortgages, subprime loans are estimated to have made up about 20% of originations in 2006. By the first quarter of 2008, the subprime share was effectively zero. Since then, increased FHA lending—identified here by Ginnie Mae's share—has revived this segment of the market.
The graph is pretty incredible. The rapid growth and even more rapid contraction of the non-agency sector are directly correlated to the rise and fall of real estate prices. The ease with which non-prime borrowers could secure non-traditional forms of financing, proved to be beneficial to all parties involved… as long as property values continued to appreciate. When that segment fell apart during the initial stages of the credit crisis massive amounts deleveraging ensued, affecting more than just housing.
Even though non-agency securitization is still a non-player in mortgage lending, the government has stepped in to pick up the slack. As evidenced by the huge surge in GNMA market share since mid 2007. It tough to be bullish on the prospects for housing outside of the government tax credit programs and government subsidized lending. The sustainability of a recovery in the housing market is dependent on sources of demand that are also sustainable. Reinflating prices, or simply putting a quick floor under prices, provides little to be positive about further out.
Cliff J. Reynolds Jr., Investment Analyst
Lockheed Martin (LMT) is cheap
Shares of Lockheed Martin have been pressured all year by the shake-up in the U.S. defense budget. The firm’s stock has recently traded even lower on weaker-than-expected 2010 guidance, which has caused analysts to take a conservative view on long-term revenue growth and margins.
These concerns have pushed Lockheed’s valuation near historical lows, but the firm’s long-term potential remains intact. Much of Lockheed’s revenue is tied to the baseline defense budget, which is not the focus of U.S. defense spending cuts. The firm’s other main source of revenue is the next-generation F-35 Joint Strike Fighter plane, which serves as a very unique growth driver that other defense contractors envy.
Pension costs are another concern among investors, with significant headwinds likely in 2010 and 2011. However, the majority of pensions costs are covered by the government – pension expense is much less important for defense contractors than in companies with primarily commercial business.
Lockheed’s profitability is top-class. The company’s return on equity is over 50%, which means they generate more than 50 cents worth of profits from each dollar invested by shareholders. For comparison sake, the S&P 500’s trailing 12-month ROE is 3.62%.
The company also generates an impressive $8.74 of free cash flow per share of common equity. Free cash flow allows a company to reinvest in its own business for growth and, in turn, boost shareholder returns. Lockheed also does a great job of returning free cash flow to shareholders through stock buybacks and growing dividend payments.
Trading just above 9 times forward earnings, Lockheed remains very attractive assuming the baseline defense budget remains at least flat and that the outlook for F-35 funding and execution is sound. The baseline budget should remain strong given aging equipment and the need to address new threats. The higher risk lies in F-35 execution (just look at how Boeing’s stock has responded to delays with their new 787 Dreamliner).
Defense valuations are unusually low across the board, even when compared to prior periods of declining defense spending. Despite continual earnings growth and high levels of free cash flow, multiple compression implies a worsening long-term outlook for defense contractors. But defense companies are like insurance: no one knows when the next war or crisis will break out, but when it does, margins and sales rocket.
--
Peter J. Lazaroff, Investment Analyst
These concerns have pushed Lockheed’s valuation near historical lows, but the firm’s long-term potential remains intact. Much of Lockheed’s revenue is tied to the baseline defense budget, which is not the focus of U.S. defense spending cuts. The firm’s other main source of revenue is the next-generation F-35 Joint Strike Fighter plane, which serves as a very unique growth driver that other defense contractors envy.
Pension costs are another concern among investors, with significant headwinds likely in 2010 and 2011. However, the majority of pensions costs are covered by the government – pension expense is much less important for defense contractors than in companies with primarily commercial business.
Lockheed’s profitability is top-class. The company’s return on equity is over 50%, which means they generate more than 50 cents worth of profits from each dollar invested by shareholders. For comparison sake, the S&P 500’s trailing 12-month ROE is 3.62%.
The company also generates an impressive $8.74 of free cash flow per share of common equity. Free cash flow allows a company to reinvest in its own business for growth and, in turn, boost shareholder returns. Lockheed also does a great job of returning free cash flow to shareholders through stock buybacks and growing dividend payments.
Trading just above 9 times forward earnings, Lockheed remains very attractive assuming the baseline defense budget remains at least flat and that the outlook for F-35 funding and execution is sound. The baseline budget should remain strong given aging equipment and the need to address new threats. The higher risk lies in F-35 execution (just look at how Boeing’s stock has responded to delays with their new 787 Dreamliner).
Defense valuations are unusually low across the board, even when compared to prior periods of declining defense spending. Despite continual earnings growth and high levels of free cash flow, multiple compression implies a worsening long-term outlook for defense contractors. But defense companies are like insurance: no one knows when the next war or crisis will break out, but when it does, margins and sales rocket.
--
Peter J. Lazaroff, Investment Analyst
Daily Insight
U.S. stocks recouped Wednesday’s losses and them some as the first look at third-quarter GDP topped the consensus estimate and continuing jobless claims fell substantially. The growth number was very much boosted by government stimulus, two aspects of which have now expired, and it is highly likely the drop in continuing unemployment claims was due to exhaustion of benefits rather than job creation, but hey this is the first positive GDP reading we’ve seen in over a year so the market rejoiced.
The broad market was driven by the sectors that led it lower the day before – financials, basic materials, consumer discretionary and energy. Consumer discretionary and energy shares got clocked Wednesday on concerns that consumer activity will wane again, but the GDP report showed spending was strong thanks to clunker cash, so all is suddenly well. Sorry for the sarcasm, but the especially mercurial nature of the market these days is a bit strange you must admit.
Advancers trounced decliners by an 8-to-1 margin and volume was fairly strong as 1.4 billion shares traded on the NYSE Composite – roughly 8% more than the six-month average.
The dollar was abused.
Market Activity for October 29, 2009
 Third Quarter GDP
The Commerce Department reported that GDP posted its first positive reading in over a year and thus the “great recession” has ended! That alone is reason to celebrate, and the actual reading offered an even greater celebratory mood as it came in above expectations. However, the party may prove fleeting, which I’ll get to below.
Third-quarter GDP beat expectations of 3.2% growth to post the strongest reading since Q3 2007 of 3.5% at a real annual rate. This ends the longest and most severe recession in the post-WWII era.
The biggest contributor to GDP was the largest component of the figure – personal consumption. PC roared at a 3.4% annual rate, contributing 2.36 percentage points of the 3.5% GDP increase. Without doubt, this figure was fueled by car and home sales as clunker cash, the homebuyers’ tax credit and fed induced rock-bottom interest rates encouraged buying even as households struggle to repair balance sheets.
The next largest contributor was gross private investment, accounting for 1.22 percentage points of the 3.5% GDP gain. The 11.5% jump in private investment was largely driven by a huge 23.4% rise in home building (residential fixed investment, if you want the technical term). This marked the first contribution from housing in 16 quarters. The business side of things was lacking as non residential structures fell 9% (which followed crater-like declines of 17.3% and 43.6% in the prior two quarters, respectively). Equipment and software investment rose just 1.1% (following declines of 4.9% and 36.4% in the previous two quarters, respectively). It would be nice to see this figure driven by business investment, but we knew this wasn’t the case by the data that’s been released.
Inventories contributed to GDP after the record slashing in stockpiles that took place in the previous quarter. The change in inventories added 0.94 percentage point to GDP (this is part of the overall gross private investment figure). However, I’ll note that inventories did not rise – the rebuilding process has yet to take place. They simply declined at a slower pace than the previous quarter (which wasn’t hard to do) and that’s all it takes for this component to contribute*. (If not for the unprecedented, since these records began in 1947, pace of slashing in the previous quarter the decline in inventories in Q3 would be the all-time record).
And then we have the government, which contributed 0.48 percentage points to Q3 GDP as federal spending offset a decline in state and local government spending.
Surprisingly, net exports failed to contribute, subtracting 0.53 percentage points. Thus, the Fed’s crushing of the dollar via their massive easing campaign provided zero benefit.
To summarize, economic growth expanded at a strong pace due to short-term government stimulus that boosted purchases of cars and homes. The car sales, specifically in one month (August), certainly helped fire up the quarter’s consumption reading and also assisted in the inventory figure adding to GDP. The tax credit fueled home sales, which allowed for some homebuilding. However, the hangover effect that will result will be tough to deal with, we have only delayed the repair to household balance sheets that needs to occur as debt levels remain high and the very weak labor market makes this situation especially difficult.
I remain quite concerned that Congress will become desperate as the 2010 elections draw nearer and the jobless rate remains very elevated and growth subdued. One should always be aware of the collective ignorance of Washington and their unshakable ability to cause things to deteriorate as they lurch for more short-term growth. To put this in more erudite terms, it’s what Hayek termed the “pretense of knowledge.” Every time Washington intervenes by attempting to drive the economy in the direction they see fit, stepping in front of the market’s natural job of price discovery and resource allocation (albeit messy and choppy at times), it fails.
The next GDP report should get another bounce from inventories – although the jury is still out as to whether stockpiles will actually rise and the degree to which this component boosts GDP – but after this large pick up in personal consumption, even in the face of huge headwinds, it means that the fourth quarter will likely receive little if any help from the largest component of GDP.
Initial Jobless Claims
The Labor Department reported that initial jobless claims fell 1,000 to 530,000 in the week ended October 24 – economists had expected claims to fall to 525K. The four-week average, which smoothes this volatile data out, fell 6,000 to 526,250.
 Continuing claims fell a large 148,000 to 5.797 million and the extended and emergency compensation claims both fell as well. However, with the duration of unemployment at record levels one has to assume that this decline in continuing claims is completely due to benefits expiring.
 Have no fear though Washington is riding to the rescue – there’s a bill moving through Congress, the same one that has the homebuyers’ tax credit extension attached to it, that will extend jobless benefits for another 20 weeks. Hooray!

Have a great weekend!
Brent Vondera, Senior Analyst
The broad market was driven by the sectors that led it lower the day before – financials, basic materials, consumer discretionary and energy. Consumer discretionary and energy shares got clocked Wednesday on concerns that consumer activity will wane again, but the GDP report showed spending was strong thanks to clunker cash, so all is suddenly well. Sorry for the sarcasm, but the especially mercurial nature of the market these days is a bit strange you must admit.
Advancers trounced decliners by an 8-to-1 margin and volume was fairly strong as 1.4 billion shares traded on the NYSE Composite – roughly 8% more than the six-month average.
The dollar was abused.
Market Activity for October 29, 2009
Third Quarter GDPThe Commerce Department reported that GDP posted its first positive reading in over a year and thus the “great recession” has ended! That alone is reason to celebrate, and the actual reading offered an even greater celebratory mood as it came in above expectations. However, the party may prove fleeting, which I’ll get to below.
Third-quarter GDP beat expectations of 3.2% growth to post the strongest reading since Q3 2007 of 3.5% at a real annual rate. This ends the longest and most severe recession in the post-WWII era.
The biggest contributor to GDP was the largest component of the figure – personal consumption. PC roared at a 3.4% annual rate, contributing 2.36 percentage points of the 3.5% GDP increase. Without doubt, this figure was fueled by car and home sales as clunker cash, the homebuyers’ tax credit and fed induced rock-bottom interest rates encouraged buying even as households struggle to repair balance sheets.
The next largest contributor was gross private investment, accounting for 1.22 percentage points of the 3.5% GDP gain. The 11.5% jump in private investment was largely driven by a huge 23.4% rise in home building (residential fixed investment, if you want the technical term). This marked the first contribution from housing in 16 quarters. The business side of things was lacking as non residential structures fell 9% (which followed crater-like declines of 17.3% and 43.6% in the prior two quarters, respectively). Equipment and software investment rose just 1.1% (following declines of 4.9% and 36.4% in the previous two quarters, respectively). It would be nice to see this figure driven by business investment, but we knew this wasn’t the case by the data that’s been released.
Inventories contributed to GDP after the record slashing in stockpiles that took place in the previous quarter. The change in inventories added 0.94 percentage point to GDP (this is part of the overall gross private investment figure). However, I’ll note that inventories did not rise – the rebuilding process has yet to take place. They simply declined at a slower pace than the previous quarter (which wasn’t hard to do) and that’s all it takes for this component to contribute*. (If not for the unprecedented, since these records began in 1947, pace of slashing in the previous quarter the decline in inventories in Q3 would be the all-time record).
And then we have the government, which contributed 0.48 percentage points to Q3 GDP as federal spending offset a decline in state and local government spending.
Surprisingly, net exports failed to contribute, subtracting 0.53 percentage points. Thus, the Fed’s crushing of the dollar via their massive easing campaign provided zero benefit.
To summarize, economic growth expanded at a strong pace due to short-term government stimulus that boosted purchases of cars and homes. The car sales, specifically in one month (August), certainly helped fire up the quarter’s consumption reading and also assisted in the inventory figure adding to GDP. The tax credit fueled home sales, which allowed for some homebuilding. However, the hangover effect that will result will be tough to deal with, we have only delayed the repair to household balance sheets that needs to occur as debt levels remain high and the very weak labor market makes this situation especially difficult.
I remain quite concerned that Congress will become desperate as the 2010 elections draw nearer and the jobless rate remains very elevated and growth subdued. One should always be aware of the collective ignorance of Washington and their unshakable ability to cause things to deteriorate as they lurch for more short-term growth. To put this in more erudite terms, it’s what Hayek termed the “pretense of knowledge.” Every time Washington intervenes by attempting to drive the economy in the direction they see fit, stepping in front of the market’s natural job of price discovery and resource allocation (albeit messy and choppy at times), it fails.
The next GDP report should get another bounce from inventories – although the jury is still out as to whether stockpiles will actually rise and the degree to which this component boosts GDP – but after this large pick up in personal consumption, even in the face of huge headwinds, it means that the fourth quarter will likely receive little if any help from the largest component of GDP.
Initial Jobless Claims
The Labor Department reported that initial jobless claims fell 1,000 to 530,000 in the week ended October 24 – economists had expected claims to fall to 525K. The four-week average, which smoothes this volatile data out, fell 6,000 to 526,250.
Continuing claims fell a large 148,000 to 5.797 million and the extended and emergency compensation claims both fell as well. However, with the duration of unemployment at record levels one has to assume that this decline in continuing claims is completely due to benefits expiring.Have no fear though Washington is riding to the rescue – there’s a bill moving through Congress, the same one that has the homebuyers’ tax credit extension attached to it, that will extend jobless benefits for another 20 weeks. Hooray!Have a great weekend!
Brent Vondera, Senior Analyst
Thursday, October 29, 2009
Afternoon Review: GDP and Lockheed Martin (LMT)
A bigger-than-expected GDP reading lifted markets today, but two items provide what could be a temporary boost.
First, personal consumption expenditures jumped 3.4% thanks to a pop in car sales, which were aided by the temporary cash-for-clunkers program. Cash-for-clunkers brought buyers to the market that normally would have waited to make a car purchase in the future, thus the program borrowed from future demand. As a result, we can’t expect to see car sales – which accounted for a full percentage point of the overall increasing GDP for the quarter – to provide this type of boost again anytime soon.
Second, homebuilding soared 23.5%, adding a half percentage point to GDP growth. This too may be a temporary as the federal homebuyer’s tax credit stirred demand. It appears the tax credit will be extended, but it can’t last forever.
The last few days I have talked about consumer headwinds and potential consequences for the economy. The first story in today’s quick hit explains that inventories will take over for the consumer in the coming quarters. Let’s hope that happens.
On a totally different note…I can’t help but notice how cheap Lockheed Martin (LMT) shares are looking.
LMT’s guidance showed us that 2010 will be weaker-than-expected, which is causing analysts to rein in long-term revenue growth and margins estimates. But LMT’s program positions, which are tied to the baseline defense budget (which doesn’t include wars in Iraq and Afghanistan) and the F-35 Joint Strike Fighter (the next-gen fighter plane), keep their long-term potential intact.
LMT trades at a whopping 47% discount to the S&P 500. Yet the firm generates $8.74 of free cash flow per share of common equity, has a return on equity over 50%, and pays a 3.6% dividend that grows more than 20% annually.
Defense valuations are unusually low across the board, even when compared to prior periods of declining defense spending. But, defense companies are like insurance: no one knows when the next war or crisis will break, but when it does, margins and sales rocket. Now is your chance to buy them cheap.
More to come on LMT tomorrow…
Quick Hits
- Inventories May Take Over From U.S. Consumers as Engine of Economic Growth
- Fed Ending Treasury Purchases That Held Down Yields, Stabilized Housing
- Weak Dollar Is ‘Welcome Change’ for Profits
--
Peter J. Lazaroff, Investment Analyst
Daily Insight
U.S. stocks extended their losing streak to four sessions and Wednesday’s losses accelerated to the close, but looking on the bright side the downside was nothing when considering yesterday was the 80th Anni of the two days that kicked off the 1929 crash.
Certainly, the 5% pullback since the near-term high hit on October 19 (also a meaningful date – the day of the 1987 crash) is hardly consequential considering the significant 60% rally from the March lows. Undoubtedly we’ll get an actual correction, even with the Fed’s unprecedented monetary stimulus that has encouraged money to flow into everything from stocks, to bonds (gov’t and corporate), to gold, oil and copper – it’s unlikely we have ever seen such correlation before. But this move to the downside cannot be defined as a correction yet – a decline of 10% or more is needed to use this term to define the trend.
The broad market began the session slightly lower but the slide was on once the new home sales data printed a number that was not even close to expectations, which added to concerns that stock prices have gotten ahead of the realities on the ground.
The Dow Transportation Average continues to get slammed and this time, unlike the slight pullback in June-early/July, the trannies have declined at twice the pace of the overall market. Transports are a very good indication with regard to the degree of the cycle and their earnings reports show things have bounced from the doldrums but the underlying businesses remain weak, which is why the prices are taking a hit. The group may be portending more weakness to come over the very near term for the broad market.
Financials was the worst-performing sector on the day, not far behind were basic material, energy and consumer discretionary shares. Telecoms were the only sector to buck the day’s trend after Qwest reported good results at its business-markets unit.

The bad news buck has rallied for five days now. As we keep saying, and I don’t enjoy typing such things, the safety trade and overall concerns regarding the pace of expansion is all the U.S. dollar has going for it at this time.
Market Activity for October 28, 2009
 Earnings Season
Third-quarter earnings season results are quietly eroding as reports from the sectors that have been hardest hit by this economic maelstrom roll in (I’m referring to industrials, energy and basic material sectors). Overall earnings results, which appeared to be holding in at single-digit declines, have moved to the negative teens (down 17% thus far regarding ex-financial results).
Based on the percentage of hardest hit sectors that still have to report Q3 results will end up roughly 16% lower (down 22%-23% on the ex-financial reading). We’ve concentrated on the ex-financial sector reading for two years now as bank earnings were crushed by the bursting of the housing market bubble. Now the sector is being temporarily propped up by the Fed’s ZIRP (zero interest-rate policy) as it helps to mask credit-quality woes. So, the ex-financial reading remains the figure to concentrate on.
Indeed, 80% of S&P 500 members that have reported thus far have beat expectations, but those were low-ball estimates. S&P 500 profits have declined for nine-straight quarters now, a post-WWII record. At this stage of the game, profits should be down in the low single-digits at worst, especially since firms have aggressively shed costs as payrolls have been slashed. The fact that earnings declines remain much worse is quite telling.
Mortgage Applications
The Mortgage Bankers Association’s index of applications fell for a third straight week, with large declines over the past two weeks. Apps fell 12.3% in the week ended October 23, following a 13.7% decline in the prior week.
The index was led lower by a 16.2% plunge in refinancing activity (which was down 16.8% in the previous week) as the 30-year fixed rate mortgage remained above 5.00%. And maybe it’s more than that, possibly the vast majority of homeowners who can refi already have. Purchases fell 5.2%, after a 7.6% drop in the previous week and a 5.0% decline in the week ended October 9.

Durable Goods Orders
The Commerce Department reported that durable goods orders rose 1.0% in September (in line with expectations), following a rather large 2.6% decline in August. Excluding transportation (which is an especially volatile aspect of the report), orders rose 0.9% -- also right in line with expectations.
Transportation orders rose 1.1% as defense orders jumped 12.5% in September. Vehicles and parts fell 0.1% and commercial aircraft orders were down 2%.
Ex-trans orders were boosted by a nice 7.9% bounce in machinery orders (following a 0.8% rise in August and a 7.7% decline in July), but was weighed down by a 0.2% decline in computer, electronic orders and a 0.9% drop in electrical equipment orders.
The shipments of durable goods, not the orders, is what flows into the GDP report and that figure rose 0.8% in September and 6.6% at an annual rate for the third quarter. So, durable goods will contribute to the GDP report for Q3, which we’ll get today. The business spending side won’t though, as this figure fell 8.3% at an annual rate during Q3. It should, however, help out in the fourth quarter as orders for this segment rose, so the shipments should show up in the Q4 GDP reading.
The report also showed that manufacturers continue to cut inventories – the durable goods inventory-to-shipments ratio fell to 1.77 from 1.80 months worth. The pace of inventory liquidation was significantly slighter than that of the previous quarter (almost impossible not to be as the inventory slashing that occurred in the second quarter set a record – this data goes back to 1947) and that’s all it takes for inventories to make a statistical contribution to GDP.
New Home Sales
New home sales unexpectedly declined for the first time in five months in September, a sign that the housing recovery will loss momentum as the tax credit currently in place has essentially expired. (The expiration is officially November 30 right now, but the contract needs to close by that date and originations in back-half of September would have had little chance of meeting that date – so potential buyers didn’t chance it.) This decline ended a four-month streak of increasing home sales.
Sales fell to 402,000 at an annual rate, or 3.6%, after printing 417,000 in August. The market had expected new home sales to jump to 440,000 for September, so quite a large miss.
 The figure was led lower by a 10% drop in the South and a 10.6% decline in the West. These are the two main regions for new homes, making up 70% of the market. Surely, the expiration of California’s new home tax credit in August resulted in the pullback in the West region. New home sales jumped 34% in the Midwest (this region makes up 17% of the market) and were flat in the Northeast (makes up just 10% of the new home market).
The median price of a new home rose 2.5% for the month (which didn’t prove very helpful for sales) but is down 9.1% from the year-ago period, coming in at $204,800 vs. $225,200 in September 2008.
 The supply of new homes, relative to the pace of sales, was unchanged at 7.5 months worth of supply.
 In short, the first-time homebuyers federal tax credit and the California new home tax credit certainly front-loaded sales and I believe it is reasonable to believe that there will be a degree of hangover that must be dealt with over the next few months as a result. This sums up basically every policy actions Washington has taken to combat the housing and economic recessions – there will be blowbacks to deal with as the agenda is extremely short-term in nature.
Today’s Data
This morning we get the first look at Q3 GDP along with initial jobless claims.
GDP is going to show that the longest and most severe recession in the post-WWII era has ended, so we can be thankful for that. The number is expected to show economic growth came in at a 3.2% real annual rate. I think it is likely we’ll get a number even better than this, a range of 3.5%-4.0% is definitely possibly as the one-time/one-quarter events of “cash for clunkers” and the homebuyers’ tax credit (which led sales higher and fomented an increase in home building) propelled GDP. The latest out of Washington on the home tax credit front is the $8,000 credit will be extended to April 30 and even people who have lived in a home for five years will be offered a $6500 tax credit if they choose to move. This is just more front-loading though and makes the hangover that much worse. For the fourth quarter GDP, we better start to see a big pick up in inventory rebuilding or the next economic figure will disappoint – of course you need final demand to make a comeback before firms aggressively rebuild stockpiles and demand will prove lacking due to the aggressive nature of job cuts and overall languid labor market.
The jobless claims figures will need to show a trend down to 500K, currently stuck in the 525K-550K range. If these two figures beat expectations the market should find reason to rally, especially after the recent pullback. However, if both fail to meet or beat the recent return to the safety trade will continue.
Have a great day!
Brent Vondera, Senior Analyst
Certainly, the 5% pullback since the near-term high hit on October 19 (also a meaningful date – the day of the 1987 crash) is hardly consequential considering the significant 60% rally from the March lows. Undoubtedly we’ll get an actual correction, even with the Fed’s unprecedented monetary stimulus that has encouraged money to flow into everything from stocks, to bonds (gov’t and corporate), to gold, oil and copper – it’s unlikely we have ever seen such correlation before. But this move to the downside cannot be defined as a correction yet – a decline of 10% or more is needed to use this term to define the trend.
The broad market began the session slightly lower but the slide was on once the new home sales data printed a number that was not even close to expectations, which added to concerns that stock prices have gotten ahead of the realities on the ground.
The Dow Transportation Average continues to get slammed and this time, unlike the slight pullback in June-early/July, the trannies have declined at twice the pace of the overall market. Transports are a very good indication with regard to the degree of the cycle and their earnings reports show things have bounced from the doldrums but the underlying businesses remain weak, which is why the prices are taking a hit. The group may be portending more weakness to come over the very near term for the broad market.
Financials was the worst-performing sector on the day, not far behind were basic material, energy and consumer discretionary shares. Telecoms were the only sector to buck the day’s trend after Qwest reported good results at its business-markets unit.
The bad news buck has rallied for five days now. As we keep saying, and I don’t enjoy typing such things, the safety trade and overall concerns regarding the pace of expansion is all the U.S. dollar has going for it at this time.
Market Activity for October 28, 2009
Earnings SeasonThird-quarter earnings season results are quietly eroding as reports from the sectors that have been hardest hit by this economic maelstrom roll in (I’m referring to industrials, energy and basic material sectors). Overall earnings results, which appeared to be holding in at single-digit declines, have moved to the negative teens (down 17% thus far regarding ex-financial results).
Based on the percentage of hardest hit sectors that still have to report Q3 results will end up roughly 16% lower (down 22%-23% on the ex-financial reading). We’ve concentrated on the ex-financial sector reading for two years now as bank earnings were crushed by the bursting of the housing market bubble. Now the sector is being temporarily propped up by the Fed’s ZIRP (zero interest-rate policy) as it helps to mask credit-quality woes. So, the ex-financial reading remains the figure to concentrate on.
Indeed, 80% of S&P 500 members that have reported thus far have beat expectations, but those were low-ball estimates. S&P 500 profits have declined for nine-straight quarters now, a post-WWII record. At this stage of the game, profits should be down in the low single-digits at worst, especially since firms have aggressively shed costs as payrolls have been slashed. The fact that earnings declines remain much worse is quite telling.
Mortgage Applications
The Mortgage Bankers Association’s index of applications fell for a third straight week, with large declines over the past two weeks. Apps fell 12.3% in the week ended October 23, following a 13.7% decline in the prior week.
The index was led lower by a 16.2% plunge in refinancing activity (which was down 16.8% in the previous week) as the 30-year fixed rate mortgage remained above 5.00%. And maybe it’s more than that, possibly the vast majority of homeowners who can refi already have. Purchases fell 5.2%, after a 7.6% drop in the previous week and a 5.0% decline in the week ended October 9.
Durable Goods Orders
The Commerce Department reported that durable goods orders rose 1.0% in September (in line with expectations), following a rather large 2.6% decline in August. Excluding transportation (which is an especially volatile aspect of the report), orders rose 0.9% -- also right in line with expectations.
Transportation orders rose 1.1% as defense orders jumped 12.5% in September. Vehicles and parts fell 0.1% and commercial aircraft orders were down 2%.
Ex-trans orders were boosted by a nice 7.9% bounce in machinery orders (following a 0.8% rise in August and a 7.7% decline in July), but was weighed down by a 0.2% decline in computer, electronic orders and a 0.9% drop in electrical equipment orders.
The shipments of durable goods, not the orders, is what flows into the GDP report and that figure rose 0.8% in September and 6.6% at an annual rate for the third quarter. So, durable goods will contribute to the GDP report for Q3, which we’ll get today. The business spending side won’t though, as this figure fell 8.3% at an annual rate during Q3. It should, however, help out in the fourth quarter as orders for this segment rose, so the shipments should show up in the Q4 GDP reading.
The report also showed that manufacturers continue to cut inventories – the durable goods inventory-to-shipments ratio fell to 1.77 from 1.80 months worth. The pace of inventory liquidation was significantly slighter than that of the previous quarter (almost impossible not to be as the inventory slashing that occurred in the second quarter set a record – this data goes back to 1947) and that’s all it takes for inventories to make a statistical contribution to GDP.
New Home Sales
New home sales unexpectedly declined for the first time in five months in September, a sign that the housing recovery will loss momentum as the tax credit currently in place has essentially expired. (The expiration is officially November 30 right now, but the contract needs to close by that date and originations in back-half of September would have had little chance of meeting that date – so potential buyers didn’t chance it.) This decline ended a four-month streak of increasing home sales.
Sales fell to 402,000 at an annual rate, or 3.6%, after printing 417,000 in August. The market had expected new home sales to jump to 440,000 for September, so quite a large miss.
The figure was led lower by a 10% drop in the South and a 10.6% decline in the West. These are the two main regions for new homes, making up 70% of the market. Surely, the expiration of California’s new home tax credit in August resulted in the pullback in the West region. New home sales jumped 34% in the Midwest (this region makes up 17% of the market) and were flat in the Northeast (makes up just 10% of the new home market).The median price of a new home rose 2.5% for the month (which didn’t prove very helpful for sales) but is down 9.1% from the year-ago period, coming in at $204,800 vs. $225,200 in September 2008.
The supply of new homes, relative to the pace of sales, was unchanged at 7.5 months worth of supply.In short, the first-time homebuyers federal tax credit and the California new home tax credit certainly front-loaded sales and I believe it is reasonable to believe that there will be a degree of hangover that must be dealt with over the next few months as a result. This sums up basically every policy actions Washington has taken to combat the housing and economic recessions – there will be blowbacks to deal with as the agenda is extremely short-term in nature.Today’s Data
This morning we get the first look at Q3 GDP along with initial jobless claims.
GDP is going to show that the longest and most severe recession in the post-WWII era has ended, so we can be thankful for that. The number is expected to show economic growth came in at a 3.2% real annual rate. I think it is likely we’ll get a number even better than this, a range of 3.5%-4.0% is definitely possibly as the one-time/one-quarter events of “cash for clunkers” and the homebuyers’ tax credit (which led sales higher and fomented an increase in home building) propelled GDP. The latest out of Washington on the home tax credit front is the $8,000 credit will be extended to April 30 and even people who have lived in a home for five years will be offered a $6500 tax credit if they choose to move. This is just more front-loading though and makes the hangover that much worse. For the fourth quarter GDP, we better start to see a big pick up in inventory rebuilding or the next economic figure will disappoint – of course you need final demand to make a comeback before firms aggressively rebuild stockpiles and demand will prove lacking due to the aggressive nature of job cuts and overall languid labor market.
The jobless claims figures will need to show a trend down to 500K, currently stuck in the 525K-550K range. If these two figures beat expectations the market should find reason to rally, especially after the recent pullback. However, if both fail to meet or beat the recent return to the safety trade will continue.
Have a great day!
Brent Vondera, Senior Analyst
Wednesday, October 28, 2009
Odds stacked against the consumer
Yesterday I briefly mentioned the relief consumers got last year from falling energy prices and how that “stimulus” at the pump is fading as gasoline nudges up against $3 a gallon. Today, I am noticing that breakfast in America is getting pricier as well with tea, cocoa, sugar, and coffee prices all hitting multi-year highs. In addition, bad weather in the U.S. Midwest may put some upward pressure on corn and soybean prices. All of these rising costs leave less cash for discretionary spending.
This trend couldn’t occur at a worst time with holiday shopping season just around the corner. Many businesses rely on holiday sales to hit their quarterly and/or annual targets, so the prospects of dismal holiday spending is concerning. It is possible consumers will unleash some pent-up demand after spending two years forgoing purchases to bolster savings, but recent surveys aren’t giving much hope.
The NPD Group shows in its survey that 30% of adults are going to be cutting holiday spending this year from last year’s very low levels. Meanwhile, Deloitte Consulting concluded from their broad survey that “U.S. shoppers will buy fewer gifts and spend more on items such as clothes, entertaining and home furnishings during the holiday season.” Surveys like these make it impossible to get excited about the strength of consumer spending.
Earlier in the week the Conference Board’s measure of consumer confidence came in at 47.7, which is not only abysmal but also doesn’t match up well to past recoveries. According to Gluskin-Sheff:
- The average level of consumer confidence at the end of a recession is 71.5 (data back to 1967, cover 7 cycles).
- The average level during recession is 72.0 and even excluding the latest downturn, the average was 65.9.
- The average level during an expansion is at 102.0.
- The average consumer confidence is 90.5 during periods when the S&P 500 has gained 60% or more.
All of the above makes it difficult to believe that the nascent recovery is sustainable if consumer spending, which makes up 70% of GDP, remains low.
On the other hand, evaluating a recovery’s sustainability with consumer spending is tricky because consumer spending doesn’t always snapback quickly. Consider these facts (complements of J.P. Morgan):
- Over 60% of the time, consumer spending in the first quarter of an expansion is less than 5% growth; and 30% of the time, consumer spending is down 1% to flat.
- 75% of recoveries see consumer spending growth lower than overall GDP growth during the first nine months of the expansion (typically investment spending leads).
- In 25% of recoveries, consumer spending averages 2.3% growth in the first nine months, yet GDP during that time grows 3.1%.
I would argue that the consumer is in a worse position today than in past cycles, but at least these statistics provide a glimmer of hope.
--
Peter J. Lazaroff, Investment Analyst
Subscribe to:
Posts (Atom)