A round of economic data didn’t help matters as initial jobless claims refuse to fall below the 500K level and mortgage delinquencies and foreclosure rates continue to rise – although high jobless claims and terribly elevated foreclosure rates haven’t had an adverse effect on stocks thus far during this meteoric rise from the March depths; maybe something has changed as we close in on year end – we shall see.
There was a pretty good flood into the short-end of the Treasury curve as the two-year note fell 4 basis points to yield 0.7%. The two-year yield hasn’t hit this level since we were in the middle of the storm in December 2008 – maybe fund managers have decided to begin booking equity-market gains and sit in Treasury securities to year end.
Still, the 1.34% decline in the broad market was hardly substantial considering the spike in prices over the past eight months; the rush into the Treasury market – the two-year yield has plunged 30 basis points since late October, the 10-year yield is down 20 bps over this four-week span – would normally put significant pressure on stocks, yet they are barely off recent highs. It’s a strange market environment for sure. The broad market was actually down 2% at the day’s nadir, but rallied in the final 90 minutes to erase a good deal of those losses.
Energy shares led the decline (down 2.07%) with financials and information technology not far behind. Traditional areas of safety, consumer staples and health-care, were the relative winners on the session – down 0.33% and 0.53%, respectively.
Market Activity for November 19, 2009
 Initial Jobless Claims
The Labor Department reported that initial jobless claims held steady last week at 505,000 (in line with the expectations of 504K) from the upwardly revised reading of the prior week -- originally estimated at 502K, but revised up slightly to 505K. The four-week average of initial claims fell 6,500 to 514,000.
We’re still waiting for that move below the 500K level.
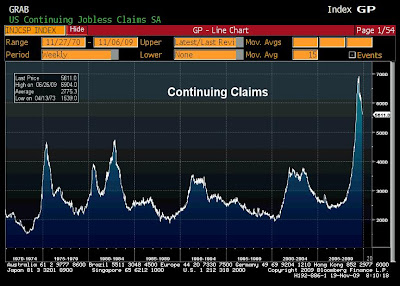
 Continuing claims fell for a ninth-straight week, down 39,000 to 5.611 million in the week ended November 7 (there’s a one week lag between initial and continuing claims). However, as we’ve been talking about, jobless benefit extensions rose, more than offsetting the decline in standard continuing claims. As the unemployed see their traditional 26 weeks of benefits run out they are moved to Emergency Unemployment Compensation (EUC) and its several extensions. EUC rose 101,838 for the week and extended benefits (the various tiers to EUC) rose 17,170.
Extended benefits now run up to 99 weeks, as we discussed earlier in the week. This extremely wide social safety net (maybe more appropriate to term it a hammock) will, at the margin, keep the jobless rate high.
 I’ve put this exhaustion rate chart up several times now. It is a monthly number so it hasn’t changed since last week, but I find it helpful to paint the picture. This is the exhaustion rate of standard (26 weeks) unemployment benefits. It continues to make new highs not only because the labor market is a wreck, but also because Congress continues to add extensions.
Philly Fed
The Philadelphia Federal Reserve Bank’s survey of manufacturing activity accelerated to 16.7 in November from 11.5 in the previous month – the estimate was for a move to 12.2. This is a big reading for Philly and is a bit contrary to that of Empire Manufacturing, which showed New York-area factory activity decelerated – these are the first looks at factory activity for November.
 A couple of the sub-indices showed substantial improvement. New orders jumped to 14.8 from 6.2, great sign for next month’s activity; shipments soared to 15.7 from 3.3 – although this is a just a follow through of the prior month’s higher reading. The number of employees remained in contraction mode, but rose to -0.5 from -6.8; the average workweek moved to expansion for the first time since December 2007 – that’s when the NBER (official arbiter of business cycle expansions and contractions) stated the recession began.
However, while employees and average workweek improvements show the pace of firings declined, a couple of indicators on actual hirings moved deeper into contraction. Unfilled orders fell to -5.4 from -1.3. The delivery times readings fell to -12.7 from -9.3. These readings indicate that factories are not burdened with a degree of orders that current payroll counts cannot fill or deliver. It does not speak well for new hires because it shows they’re not needed.
Just as we’re watching for a meaningful move below 500K on initial jobless claims, we will keep a close on these two factory readings (unfilled orders and delivery times) for evidence that meaningful additions to payrolls are on the horizon.
The inventories index rose to -17.3 from -31.8 – a substantial improvement but shows firms are still destocking. A full-blown inventory dynamic is not yet upon us but GDP only needs for stockpiles to decline at a slower rate to boost the reading. The fact that this inventory reading is barely better than the average since the recession officially began (-17.3 vs. -20.4 average) illustrates that business confidence remains lackluster.
Mortgage Delinquencies
 The chart above speaks for itself, but it does exclude the inventory of foreclosures. The number of mortgages either delinquent or in foreclosure is 14.11%.
Here is the delinquency breakdown:
Among fixed rate mortgages, the delinquency rates are as follows: 5.67% of prime loans; 24.57% of subprime; 13.90% of FHA
Among adjustable rate mortgages, the delinquency rates are as follows: 12.37% of prime loans; 28.23% of subprime; 14.36% of FHA
What we have seen over the past few months is that prime loans are beginning to drive foreclosures; at the beginning of this housing contraction, it was sub-prime leading foreclosure rates higher. This tells us it is not just about bad loans written and a lack of credit standards, but the highest jobless rate in 26 years is doing the damage.
This data screams of a significant increase in home supply. The number of loans 90 days late or in foreclosure is now over 4 million, according to the Mortgage Bankers Association. To put this number into perspective, there is currently 3.8 million new and previously occupied homes for sale.
Based on such a larger number of homes waiting to hit the market I fail to see how housing escapes another round of price decline, and the resultant increase in bank losses. Economists who expect a robust economic expansion to ensue appear to be living a fantasy.
Have a great weekend!
Brent Vondera, Senior Analyst
No comments:
Post a Comment