The latest factory orders data showed very nice activity occurred in November, but it’s not enough to offset the housing news and begin to worry those in riskier assets that the Fed is about to begin the Great Unwind. I for one want to believe this manufacturing rebound is for real, but it seems so transitory – beefed up by auto assemblies that are likely to be short-lived and housing construction that looks ready to roll over again. Electronics production, which may be the only lasting story as firms must at least manage business-equipment orders to maintenance levels and even maintenance levels of purchases looks good compared to where we’re coming from, also boosted the factory orders data.
Everyone understands, or should, that housing is a central issue for the banks and that is going to keep Bernanke & Co. frozen from even gently raising short-term rates – unless forced to by the bond vigilantes pushing the long-end of the curve higher. The industry has to deal with very deep credit issues such as high credit-card and mortgage delinquencies. If home sales retrench again that will put pressure on prices and lead to additional loan problems for the banks.
Remember, we have three-seven million properties that are going to enter supply (the low end of that estimate would double the current homes available for sale figure) as the foreclosure process has been delayed due to mortgage modifications that are proving to be counter-productive. Any trouble on the sales front is going to exacerbate this situation. On top of that, there are roughly 25% of mortgages underwater (higher than the property’s value), with 5.3 million borrowers at least 20% underwater, according to industry analysts. One has to expect that at least a significant number of these troubled loans are going to be foreclosed upon. It is difficult to see how credit is going to expand; certainly it appears that lending has no business expanding until the delinquency and default rates begin to trend lower.
Treasury security prices rallied hard, the yield (which moves inverse to price) fell 6 basis points to 3.76% as there was some run to safety.
Market Activity for January 5, 2010
 Factory Orders
The Commerce Department report good news in that factory orders rose 1.1% in November, double the expectations of a 0.5% increase.
New orders for manufactured goods have now risen seven of the last eight months. Excluding transportation, new orders increased 1.9%. New orders for durable goods (those meant to last at least three years) are up two of the past three months, increasing 0.4% in November – unchanged from the previously published increase via last week’s durable goods orders reading. Computer & electronic products, also up two of the past three months, showed the largest increase of all segments for the month, surging 4.9%.
Inventories of manufactured goods were up 0.2%, marking the second month of increase. Inventories of durable goods fell though for the 11th consecutive month, down 0.3% -- transportation equipment inventories fell 0.4%, leading the decline in durable stockpiles. Stockpiles of nondurable goods rose 0.9%, the second month of increase – led by a 4.2% rise in petroleum and coal products, so there is a little depressed demand factor in this reading.
The only real negative in the report came by way of the unfilled orders figure, down 0.7% for the month – lower for 14-straight month, the longest stretch since this data began in 1992.
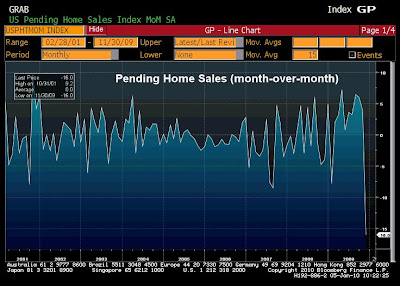
Pending Home Sales
The National Association of Realtors reported that pending home sales got slammed in November, falling 16% compared to October’s activity – the first decline in 10 months. The number was expected to decline just 2.0%. This plunge will show up via existing home sales for part of December, but mostly within January’s results. Pending home sales are contract signings for previously-owned homes. Those sales are not officially counted until the contracts close; the signing to close process is taking about six weeks on average.
 It was unclear to home-borrowers, prior to the November 4 promulgation, whether or not the tax credit would be extended so there was a rush during August, September and October to get in before the deadline, which caused a respite in sales that may extend for a couple of months – it pulled sales forward. If existing home sales officially drop by this degree that pending sales is predicting (official number is released January 25) it will erase the boost that’s occurred over the previous two months, and then some.
We should see sales rebound by early spring as that subsidy has been extended through April, although I’m not sure one should expect the tax credit to invigorate sales to the degree it did the first go around. What this pending sales data for November suggests is the degree to which sales will decline post-April 30 when the credit expires. What we are doing, just as is the case with all of the other government support, is delaying the inevitable.
By region, the Northeast and Midwest were the hardest hit as contract signings fell 25.7% in each location. The South saw contract signings decline 15%. The West held up very well, as pending sales fell just 2.7% -- this is the area with the most distressed properties and since these properties have accounted for a third of all sales over the past few months the relative out-performance for the region should not be surprising.
From a year-over-year perspective, pending home sales are up 25.1% in the West, up 21.3% in the Northeast, up 17.1% in the South and higher by 14.2% in the Midwest.
Vehicle Sales
Total U.S. vehicle sales came in better-than-expected for December, registering 11.23 million units at a seasonally-adjusted annual rate – 11.00 million was expected. For the year, vehicle sales finished at 10.425 million, down 21% -- the lowest annual figure since 1982. The year ended a heck of a lot better than things looked just a few months back, but dealers offered large incentives, interest rates remained extremely low and loan-to-value ratios were obscenely high – 93% as of the latest consumer credit data.
Ford’s sales jumped 32% during December from the year-ago level (down 15.4% for all of 2009) as the firm has seen a nice turnaround of late thanks to good products and possibly buyers’ attraction to the only U.S. maker that refused to take a government handout. GM saw sales fall 5.6% for December, even as they offered the deepest discounts. GM’s sales fell 29.7% for all of 2009.
Honda and Toyota made a good run of it in the final months of the year, but even those names saw sales fall 19.5% and 20.2%, respectively for the year.
Have a great day!
Brent Vondera, Senior Analyst
No comments:
Post a Comment