Visit us at our new home!

For new daily content, visit us at our new blog: http://www.acrinv.com/blog/

Thursday, January 14, 2010

Daily Insight

U.S. stocks shook off early-session weakness to close smartly higher on Wednesday. Analyst upgrades and earnings optimism overcame the latest energy report that showed fuel demand remains weak. The Fed’s Beige Book report (economic conditions within the Federal Reserve’s 12 bank districts) probably had little overall effect on market activity. The report showed some economic broadening as more districts reported improvement relative to the previous release, but it wasn’t terribly confirming.

Nine of the 10 major industry groups closed higher on the day, telecoms being the only loser. Health-care, financials and tech were the top performers.

The broad market currently resides at its highest level since October 1, 2008, surging 72% from the March 2009 abyss – capturing just more than half of the losses from the October 9, 2007 peak. We’ll now watch to see if the S&P 500 can make it back to its pre-Lehman collapse level of roughly 1240, just 8.3% higher and we’ll hit it.

The bulls remain in charge as the direction of stocks is more a function of earnings and interest rates than employment and GDP. Net bullishness (the difference between bullish and bearish sentiment) as measured by the American Association of Individual Investors has hit its highest level since February 2007.

Interest rates are certainly extremely low; the profit story has yet to play out -- expectations are very optimistic. The market cares little about the unemployment rate or GDP right now simply because the longer these figures remain weak (actually depressed in terms of employment and lackluster in terms of GDP thus far) the longer traders expect interest rates to remain very low. But the market should be giving a little more consideration to the jobs picture. Employers will likely wait quite a long time before they aggressively begin to hire again – they’ll want to book several quarters of good profit growth first. Besides, resource utilization rates are very low and that means they can squeeze more work out of existing employees; therefore, they will delay boosting payrolls in a meaningful manner – not to mention the delaying effects due to uncertainty about tax rates and health-care costs per worker; policymakers can remove this uncertainty in one fell swoop if they cared to do so.

While the slashing of payrolls is good for profits in the short-term, it doesn’t help final demand rebound – tough for this to occur at peak post war unemployment rates – and leads me to question the durability of earnings growth.

In addition, high joblessness doesn’t help mortgage-default rates or overall credit quality to improve. As default rates remain high, this puts additional pressure on bank capital ratios – banks will be hesitant to lend as they fear an erosion in capital adequacy ratios. This spells trouble for credit expansion.

Market Activity for January 13, 2010

Dollar, Fed Speak and a Little Oil

The U.S. dollar got a lift in early trading on hawkish comments from Fed officials. Federal Reserve Bank Presidents Plosser and Fisher (Plosser from the Philly Fed Bank and Fisher from Dallas) commented on how the FOMC should not be deterred from tightening policy by a sluggish job market or other unfortunate realities.

Plosser focused on the need to hike rates in a timely manner. He stated that: “economic slack is neither a necessary or sufficient condition to ensure low inflation.” (That kind of anti-Keynesian talk won’t get him invited to any Federal Reserve dinner parties.)

Fisher focused more on allowing the economy to adjust on its own at this point. He commented on the perils of holding interest rates artificially low, which has certainly been the case as the Fed’s $1.25 trillion in MBS has pushed mortgage rates lower -- and Treasury yields too as investors sell MBS to the Fed and buy Treasuries with the proceeds. He also engaged in a bit of digression, moving onto fiscal policy (which is obviously out of his jurisdiction), as he brilliantly stated: “While it appears urgent, if not agreeable, to use massive public spending to stimulate an economy under duress, an economy cannot sustain long-term growth under the weight of significant fiscal burdens. At some point, what is considered a temporary economic prosthesis becomes a hindrance to the workings of the private sector.”

Neither of these two are current FOMC members, so they don’t have a vote on policy.

The market apparently didn’t view these comments as siren songs as the dollar rebound was extremely short-lived and headed back down to close the session lower.
Even though we have Fed officials out there talking up the exit story on occasion, the voting members continue to infer that monetary policy will remain floored for some time still. You listen to the latter for policy guidance. Personally, I find myself in the Plosser/Fisher camp.

Moving on, the dollar weakness didn’t stop crude from falling as the February contract fell back below $80 (closed at $79.67/barrel) after the weekly Energy Department report showed stockpiles rose twice as much as expected. Total fuel demand was down 1% from the same week last year. There is really no improvement in transportation demand and that is a key indicator to watch for economic progress.

And speaking of transportation, ASI/Transmatch’s latest data on weekly freight carloads showed extreme weakness continues. The chart below is on a four-week rolling average basis.


Mortgage Applications

The Mortgage Bankers Association reported that its mortgage applications index jumped 14.3% for the week ended January 8. This followed a 0.5% rise in the prior week.
The increase was all on the refinancing side as the segment bounced 21.8% and accounted for 71.5% of all applications during the week. This bounce follows three weeks in which refinancing activity fell 38.4%. Purchases were up just 0.8%; the separate purchases index remains floored. After a rebound in home purchases during the first 10 months of 2009, the index has slid back to levels that were first hit in 1997.


The rate on the fixed 30-year mortgage averaged 5.13% for the week, down from 5.18% in the previous week.

Beige Book

The Federal Reserve’s latest analysis of economic conditions showed that activity improved in 10 of their 12 districts (up from eight in the previous report), but remained at a low level. The assessment was for the period November 21-Janaury 4. Labor markets did remain weak across the board and real estate markets are causing a serious drag on things – but of course these are widely known. Richmond and Philadelphia were the two districts that reported activity was not much changed from the last Beige Book.

Most districts reported that consumer spending was slightly greater during the holiday season relative to year ago, but well off 2007 levels – districts noted that since sales were so weak in 2008 compared to 2007 that the 2009 gains did not represent a meaningful shift in trend. Retail inventory levels remain very lean in nearly all districts. Auto sales held steady or increased slightly from the previous report. Reports on tourism were mostly flat or weak. Overall, consumers were described as cautious, prices sensitive and necessity-driven.

Manufacturing activity increased or held steady. Among districts reporting near-term expectations, the factory outlook was optimistic, but spending plans remain cautious. Most activity was reportedly driven by auto assemblies and exports to Asia.

Home sales increased in most districts, but mainly for lower-priced homes. Home prices appeared to have changed little since the last Beige Book, according to the Fed. Residential construction remained at low levels in most districts. The report mentioned that the tax credit boosted sales in November and led to an unusual slowdown in December. Commercial real estate was still weak in all districts with rising vacancy rates and falling rents.

Since the last report loan demand continued to decline or remained weak in most districts – and would have been worse if not for refinancing activity and auto loans. Credit quality continued to deteriorate.
Price pressures remained subdued, though metals prices increased and some districts reported higher agricultural prices.

Have a great day!

Brent Vondera, Senior Analyst

Tuesday, January 12, 2010

Daily Insight

U.S. stocks, at least in terms of the broad market, rallied in final hour of trading after losing all of its opening session gains and spending most of the day in negative territory. The Dow Industrial Average only spent a brief time under the cut line as it was propelled by shares of Caterpillar and United Technologies – the two stocks accounted for nearly 90% of the index’s gain.

Tech stocks were the worst-performing sector, weighing on the NASDAQ Composite as the index shed all of its morning-session gains just 30 minutes into trading and was unable to make it back to the plus side. Mid and small-cap stocks also closed to the downside, but just fractionally.

The latest trade data out of China showed exports were up strong and imports surged 56% from December 2008 – that’s got massive Chinese stimulus written all over it even if the figures are relative to extremely depressed levels of a year ago – and was responsible for most of the day’s gains. Industrials jumped 1.17% and that’s a China story.

Utility shares also performed well, up 1.10% for the session. Although, the group accounts for a much smaller percentage of the S&P 500 than industrials do so it didn’t have much impact on the index. Comments from St. Louis Fed Bank President Bullard stated the Fed is likely to keep policy floored for longer than most expect and that’s a green light for higher-dividend paying shares.

Bullard also mentioned that the Fed’s quantitative easing (QE)campaign may be extended and increased, referring to the central bank’s mortgage-backed security purchases and possibly Treasury securities too. It seems the Fed is floating messages out there to see how the market reacts. The chances of Bernanke & Co. increasing QE is heightened in my view. That’s unfortunate. At some point they are going to have to make the economy to stand on its own, or at the least force it to use just one crutch. If they choose otherwise, it will create additional problems down the road – and they’re choosing otherwise.

Market Activity for January 11, 2010 Crude, Delinquencies, Printing and the Consumer

The price of oil for February delivery hit a new 15-month high yesterday as Chinese exports recorded the first year-over-year increase in 14 months, colder than usual temperatures continue to grip the U.S. and many other parts of the world, pipeline attacks returned to the Nigerian Delta (it was a brief respite), and a declining U.S. dollar that has now erased a three-week bounce. (Crude has pulled back a bit this morning after Alcoa’s disappointing earnings report but remains solidly above $80/barrel.)

The weather will turn warmer and an extraordinary level of Chinese government stimulus will dissipate, but what will remain in the near future is a Fed that holds monetary policy at emergency levels – the only thing that will outlast this is oil infrastructure attacks within troubled parts of the world. As a result, the dollar will remain under pressure -- barring some nasty event that causes a full-fledged run for safety – and this will add more fuel to possibly propel the price of oil higher.

It is obviously impossible to predict where oil is going. I could actually see all commodity prices pulling back for a spell as supplies have probably become a bit bloated as higher prices have encouraged production and an intensification of banking-sector troubles cause traders to worry about already weak demand to get hit again.

It is only prudent to expect mortgage-delinquency rates to increase in the coming months simply because of persistently high unemployment, a shadow supply of homes that can’t be held from the market forever, and high loan-to-value ratios (additional price declines will increase the percentage of underwater mortgages). Now we have Washington looking at adding fees to the banks as a way of raising government revenue. Bad timing boys and girls, but when is Washington’s timing ever on target. Populism is running wild and I’m not sure investors are properly assessing the risks involved with such behavior. That’s the problem with pedal-to-the-metal monetary policy though; it causes a gratuitous level of complacency.

The overall point is that the likelihood of higher delinquency rates along with other financial-sector issues may just cause another run for safety and that means transitory dollar support and probably a correction in commodity prices – unless, and this is a big caveat, the Fed immediately meets this trouble by announcing they will increase their mortgage-backed security purchases. In that event, such money-printing behavior may just keep the commodity train rolling and escape what would otherwise be a normal pull-back before trending higher again.

For now, crude is showing substantial momentum and if the Fed expands QE that momentum will increase, creating some issues for an already burdened consumer. The only thing that is likely to ultimately hammer the price of oil, not a transitory pullback but a prolonged hit, is when the Fed signals they’ll begin to unwind current policy and raise interest rates. When that occurs, Katy bar the door on the oil trade; but then again, it may just mean a run for the exits with regard to all kinds of assets. This seems to be quite a way off though as Bernanke & Co. understands very well the challenges we face. While I believe they should mildly remove some accommodation and rid the economy and the market of this state of dependency, the Fed sees things quite differently.

As I’ve stated many times now, the Fed is in a box. If they begin to move now, the housing market will show its underlying foundational cracks and that will obviously have an effect on consumer activity. Yet, if they continue to keep policy floored, commodity prices (namely energy for this discussion) are very likely to trend higher, also hitting the consumers’ pocketbook – draining real incomes.

(On the consumer, what I would watch for is those first-time home-buyers tax credits to begin to take hold in the spring. These checks, which will total up to $8,000 for new home-borrowers, will boost spending or at least help consumers manage around higher crude prices or another round of economic trouble. But the ameliorative effects of this housing subsidy will prove short-lived as it provides one-and done spending. What we’ll be left with is labor market trouble that is unlikely to meaningfully ease anytime real soon. We’re in store for more extend and pretend.)

This Time They Mean It

Fourth-quarter earnings season kicked off yesterday evening with Alcoa’s earnings release. Alcoa marks the traditional beginning of quarterly earnings results, but things don’t get going in earnest until a couple of weeks later when the bulk of releases begin to stream in The market will be watching for some degree of top-line improvement – sales growth. While S&P 500 profits (bottom-line results) have sucked wind over the past nine quarters (remaining very depressed even as of the third quarter as total profits fell 15.6% and ex-financial results declined 24.1%), they have been better-than-expected as massive cost-cutting via payroll slashing has assisted the bottom line.

Prior to third-quarter earnings season, analysts were stating they would have to see some sales growth in order for the market to rise. Well, we didn’t get it as sales fell 9.6% from year-ago results. Stocks, nevertheless, continued to climb, up another 10% since the previous earnings season effectively came to an end. This time they say they mean it. We shall see.

Have a great day!


Brent Vondera, Senior Analyst

Monday, January 11, 2010

Daily Insight

U.S. stocks shook off a worse-than-expected jobs report and the largest decline in consumer credit on record to push higher as both releases boosted the longevity of ZIRP – the Fed’s zero interest-rate policy.

Industrial, commodity-related basic material and energy, along with technology shares led the way. Financials, consumer, telecom and utility shares were down on the session.

While the jobs data was not bad in terms of the degree to which payrolls declined -- a drop of 85,000 is a statistically insignificant number, the long-term unemployment numbers are more than disturbing. But when the market is going on what I believe is a very short-term mindset, easy-money delight, what is bad remains good. Because of this I wouldn’t have been surprised to see quite a substantial sell off if the data had shown a 100k increase in payrolls.

I saw a Bloomberg News reporter state that the market is excited about what this jobs data means for profit growth. For sure, the lack of hiring will help earnings advance – recall that we have talked about how there could be a couple of big-bang quarterly earnings results over the next year. Heck, slash 7.5 million payrolls and firms are going to show some level of profit growth even if sales remain weak. While there’s a good shot growth may be pretty strong for a couple of quarters, if the profits are mostly due to massive cost-cutting via payrolls this will obviously keep final demand lackluster, which means the growth is short-lived. Add in the consumer credit situation and the chance that final demand sticks is low.

So, I look each and everyday for positives to give me more confidence that a durable recovery will emerge, but the more I look the more problems I find. The bulls seem to be awfully short-sighted these days, and what we’re seeing is not a move higher based on fundamentals but a continued move to riskier assets based upon the Fed holding interest rates artificially low, in my opinion.

Volume was weak again, I really thought trading activity would rebound back to normal levels with the holidays behind us, as just 950 million shares traded on the NYSE Composite – 18% lower than even the pathetic average of the last six months. We should be seeing at least 1.4 billion trade per day.

For the week, the broad market gained 2.6%. This marks the seventh weekly gain out of the last 10 and puts the S&P 500 up 72% from the March 9 intra-day low. I should be really excited about this, but the move above 900-950 on the index just doesn’t feel right to me based on the headwinds – a number of challenges I laid out in the year’s first letter a week ago.

I think one has to build a market valuation analysis around $65 in S&P 500 earnings (earnings peaked at roughly $85 in 2007 and the cycle trough just recently came in at $45) and that means a value of 950 puts the S&P 500 at 15 times – a multiple that is right in line with the long-term average. It is tough to justify a multiple that’s above the average in light of the challenges we face.

Market Activity for January 8, 2010
December Jobs Report

The Labor Department reported a jobs report that was worse-than-expected as payrolls declined 85,000 in December (the consensus expectation was for no change, with +85K at the high-end of the range and -100K at the low end). The November payroll figure was revised higher to show a 4K increase, previously reported as an 11K decline – marks the first positive reading since December 2007. Still, all of these numbers are statistically insignificant as anything within +/- 100K is.

One thing that people were focused on was the revisions for the previous couple of months, expecting more positive changes – this is important because the revisions generally portend the future trend. While the November reading saw a positive revision, the October data was revised a bit lower, so no effective change.

In terms of industry, goods-producing industries shed 81,000 jobs -- a decent deterioration from November’s -58K; in line with the three-month average of -83K. The construction segment cut 53,000 – double the decline of November and worse also compared to the three-month average of -45K. (Keep in mind though that we had some nasty weather in December and this surely damaged the monthly figures for the segment.) The manufacturing segment shed 27,000 – better than the -35K in November and an improvement relative to the three-month average of -37K. (It seems the better employment figures within the regional factory reports were correct in signaling some improvement.)

The service-producing industries cut payrolls by 4,000. This is nothing, completely insignificant, but is a large deterioration from the 62,000 increase registered in November. The three-month average is +13K. The trade and transportation segment cut 37,000 – more than the -32K in November but better than the three-month average of -43K. Retail payrolls declined 10,000 – an improvement from the
-14K in November and also the three-month average of -21K. Business services payrolls increased 50,000, boosted by another nice pick up in temporary hiring. Temp. help increased 47,000, following +89K in November – the three-month average is +49K. Temporary hiring is a key component to watch as historically it has proved to be a nice signal that at least mild overall job growth will soon follow.

Ex-post office, the federal government added jobs but state and local gov’ts cut jobs -- states are in a world of hurt and are going to present a problem for quite some time; the Medicaid expansion will put the states on a path of financial ruin if it is ultimately passed In total, government jobs declined 21,000, but this figure is going to pick up in the months ahead. Hiring for the 2010 census will begin in earnest over the next couple of months. This is going to distort the jobs figures as (if memory serves) 800,000 workers will be needed, and those additions will be spread out over a multi-month timeline. However, it won’t be long again before the census workers are hunting for employment as this is a six-eight week gig.

The unemployment rate held at 10%, but this number is going meaningfully higher. Why? Because the civilian labor force plunged 661,000 during December. These are people who removed themselves from the labor market because they didn’t look for work during the previous four weeks – termed the “discouraged worker.” When the labor force increases, workers returning to look for work as they feel better about the chances of finding a job, the jobless rate will rise. This why the unemployment rate is a lagging indicator, continues to increase even as the economy has moved to expansion mode. That said, I think the degree to which the rate still has to rise is more pronounced this time. Look for 11% by summer.

Taking a minute to clarify the two surveys that make up the jobs data: The Establishment Survey is used by the Labor Department to measure the change in payrolls – the +/-monthly jobs number you read in the headline; it is a survey of 150,000 businesses. The Household Survey is how the government measures the unemployment rate, this number includes the self-employed; it is a survey of 60,000 households.

The U6 unemployment rate (also referred to as under-employment), which includes discouraged workers and those working part-time because they can’t find full-time work, ticked back up, rising to 17.3% from 17.2% in November – although still below the high of 17.4% hit in October.

The number of unemployed that have been out of work for at least 27 weeks (the longest duration the labor statistics track) is now 4 out of every 10 – actual percentage is 39.8%. The average duration of unemployment rose to another new high, increasing to 29.1 weeks from 28.6 in November – the third straight month in which it has exceeded the 27 weeks figure. This completely jibes with what the jobless claims data has been suggesting as continuing claims keep rising.
The average weekly hours worked reading also failed to improved, holding at the low level of 33.2 hours. The figure rose in November from its record low of 33.0 in October, but we need to see something closer to 33.8-34.0 before firms begin to substantially add workers. Hours worked were adversely affected by weather, particularly construction jobs, so one hopes some improvement would have resulted otherwise but we’ll need confirmation from the data in the coming months.
Last month I mentioned that the excitement over the November jobs report appeared a little amateur. There were a lot of people that expected the data to magically begin to post increase beginning in December and statistically significant improvements beginning in January. But it doesn’t happen this way, especially since there remains too much room with which to stretch current employee workloads, as that weekly hours worked figure suggests. However, we should begin to see a trend of positive monthly results by February/March and with some luck statistically significant increases by early summer. The problem is that firms are not seeing much by way of sales growth and that means they’ll wait eve

While that’s the brighter side of the situation, the labor market participation rate continues to make new 25-year lows and that means there will be an enormous number of people re-entering the workforce when they feel better about the labor outlook. This means we will have to see more than the usual 100K/month job growth for an extended period in order to bring the jobless rate lower. Based on what the data is suggesting, we may need 200K/month for more than 12-18 months to even bring the unemployment rate back to 8.0-8.5% by mid-2011. And even this rate is elevated from a historical perspective, the peak level of joblessness during the normal recession. To get back to our long-term average of roughly 6%, we could be waiting until 2014-2015.

I think the response we have taken to combat this serious downturn is actually doing more harm than good My concern is that as the jobless rate rises just ahead of the 2010 election, Congress will scurry to endeavor upon polices they believe will increase jobs in the short term, but does significant damage to the longer-term situation.

Consumer Credit

A point we’ve touched on a number of times, the slashing of credit-card lines, is going to work as a drag on consumer activity. There are approximately $4.5 trillion in credit-card lines outstanding (a significant percentage of which is for businesses, which is not relevant to this topic) and $874 billion is drawn upon via the consumer. These lines of credit run off of models based upon the national delinquency rate, and since delinquencies are at a record level, according to Fitch Ratings (I assume they mean post-WWII record), that means these lines will continue to be cut.

The latest Federal Reserve data on consumer credit was out Friday, showing it got whacked by $17.5 billion in November (a decline of $5 billion was expected) and is down for 10-straight months – both are the most on record. Records go back to 1943.


Have a great day!


Brent Vondera, Senior Analyst

Friday, January 8, 2010

Fixed Income Weekly

This week the market’s attention was focused primarily on comments from various Fed officials and the minutes from December’s FOMC meeting.

The Fed minutes were pretty uneventful. Some voting members are content with winding down the Fed’s purchasing program on schedule (March) while others are pushing a possible expansion of the program in order to protect the still fragile housing market from the exit of the mortgage market’s biggest investor.

So far the Fed’s exit strategy has been limited to emergency lending programs that have been slowly unwinding due to decreased demand, but if the March does end up being the final month of MBS purchases it will be the first active step by the Fed to begin tightening. It’s not surprising to see some disagreement within the FOMC.

Bernanke
Several Fed officials spoke this week, but Bernanke’s speech on Sunday at the Annual Meeting of the American Economic Association in Atlanta caught my eye. The argument he presented was based on his belief that a lack of regulation, not unnecessarily low interest rates, led to the housing bubble.

From Big Ben’s speech…
The most important source of lower initial monthly payments, which allowed more people to enter the housing market and bid for properties, was not the general level of short-term interest rates, but the increasing use of more exotic types of mortgages and the associated decline of underwriting standards… The lesson I take from this experience is not that financial regulation and supervision are ineffective for controlling emerging risks, but that their execution must be better and smarter.

This argument isn’t anything new from the Fed. The street is used to investors like Bill Gross talking up their positions on CNBC, and that’s all the Chairman is doing here. We are entering the second year of a 0-.25% target for Fed Funds and there are still 3-months to go until the Fed is finished buying MBS, so unless he wants the bond vigilantes to run his current monetary policy out of town he better keep up this sort of talk.

Exotic mortgage products did help bring monthly payments down, which in turn brought a much stronger bid to the property market. But Option Arms and the like came about only because there was enough demand from investors (Banks, Hedge Funds, Pensions, etc.) for those products. Extremely low interest rates, if left too low for too long, incentivizes investors to ignore risk in their search for additional yield which leads to more bubbles and more instability in the future. Talk up your position if you want Chairman Bernanke, but relying heavily on regulation instead of worrying about the effect monetary policy can have on asset prices is foolish and irresponsible.

Have a good weekend.

Cliff J. Reynolds Jr., Investment Analyst

Daily Insight

U.S. stocks overcame pressure from pre-market trading to gain ground Thursday after most retailers reported better-than-expected sales results for December. Financials led the broad market higher, followed by industrial and consumer discretionary shares.

I would have thought the market to hold off ahead of what will be a very important December jobs report this morning, as looked to be the case on Wednesday. While the monthly labor-market figures are always the most-watched release, this one will be especially important as many believe it will produce the first monthly payroll increase in two years. (It will also be interesting to watch how the market plays the number if it does beat expectations. A what’s-bad-is-good mentality has ruled trading and if the number gets people believing the job market is going to begin a string of increases it is likely to boost views that the Fed’s Great Unwind will occur sooner than traders would like.)

Stock-index futures put pressure on early trading after China decided to raise an interbank market interest rate. They had signaled a move was coming on Wednesday by saying policy would focus on preempting inflation rather than myopically supporting growth. I doubt the Chinese government will go much farther in terms of taking away most stimuli; they have citizen uprisings to think about (and what appears to be quite a construction bubble that they would rather deflate than burst, if possible) and thus their hands will be tied somewhat, but the move did weigh on yesterday’s activity.

With about 30 minutes left in the trading session, Bloomberg News reported on a warning issued to the banks from the Federal Reserve, preparing them to guard against losses from an end to super-duper low interest-rate environment. They mentioned reducing exposure or raise capital if needed. Financial shares, and the market in general was pretty much unaffected by the announcement. Maybe they see this as more talk than a signal to action.

You’ve got to look at this warning as a duel strategy by the Fed.
One, it is a CYA move – telling the banks don’t blame us when interest rates rise. When the Fed does begin the Great Unwind it will likely be much more aggressive than the traditional 25 basis point moves per meeting.

Two, it is lip service. The more you talk about the exit strategy the longer it buys time to keep monetary policy floored – it helps to keep inflation expectations moored (Oh, the Fed is serious about price stability so we won’t push long-term rates higher, says the market – or so the Fed hopes). We’ll see if it works in containing inflation expectations.

In any event, at some point the gravy train for the banks is going to come to an end; the yield curve is not going to remain historically steep forever, at which point one of the biggest baddest no-brainer income sources of all time will disappear – one hopes the current level of delinquency rates will have eased dramatically by that time, but that may be a serious exercise in wishful thinking.
Jobless Claims

The Labor Department reported that initial claims held steady at the 430K handle, rising just slightly to 434,000 (5K less than forecasts) in the week ended January 2. The four-week average of initial claims fell 10,250 to 450,250 -- the lowest level since the week of September 12, which is the week before the Lehman collapse and the credit crisis began its crescendo.

Continuing claims fell 179,000 to 4.802 million – that’s for standard benefits that last 26 weeks. However, emergency unemployment compensation (EUC) claims have yet again more than offset this downward move as they jumped 235,626 for the latest week. This comes off of a massive negative revision to the prior week’s EUC claims, showing a 650,839 surge after first being reported as rising 191,669. While standard claims have dropped 400,000 over the past three weeks, EUC has surged 917,000.

For new readers who may not know, EUC and it various extensions provide up to an additional 73 weeks of unemployment benefits when the traditional 26 weeks run out. This huge increase in EUC shows that long-term unemployment remains very elevated. The number of unemployed for at least 27 weeks figure within the monthly job report continued to make new highs as of the latest data. Today we’ll find out if a new record high is put in. Even if it falls a bit, this claims data shows it won’t be by much.

So the overall claims figures continue to illustrate the same picture: The trend lower in initial claims shows the pace of firings has very substantially eased. Unfortunately, hiring in earnest has yet to begin and that means the length of unemployment will remain elevated.

December Retail Figures and Looking Ahead

The December retail figures are coming in at quite respectable rates of increase, all things considered. Most retailers posted results that surpassed expectations and Retail Metrics estimates that cumulative same-store sales results rose 2.9% -- that’s based on the year-ago period when sales fell 3.6%.

Many people were concerned about the Northeast and Midwest snowstorms hurting sales. While those storms did dampen in-store traffic, it boosted online sales. Macy’s, for instance, reported a 29% jump in online sales relative to December 2008. Most of the apparel retailers did very well, no doubt the weather juiced winter-clothing sales.

The National Retail Federation will release official cumulative results on January 14.

Looking ahead, everyone understands that consumer spending is going to be restrained for a while as the jobless rate remains at hyper-elevated levels (10% has only been hit in two periods during the postwar era) and is likely to remain above 8.0%-8.5% for a couple of years at least.

It takes 100K-plus in monthly job growth for an extended period to meaningfully move the unemployment rate lower and a necessary condition for such job growth it at least average GDP growth, which means 3.5% annually – and it must be durable. Based upon the unusual amount of resource slack in the labor market today it may take growth of 4.5%-5.0% for a couple of years to get us down to 8% unemployment, which is the peak hit during the normal recession. A high jobless rate causes high delinquency rates and that means credit card lines will continue to be reduced, which will be another impediment to spending but I won’t get into that right now.

An additional burden for the consumer, and the reason I raise this looking ahead topic, may result from higher energy prices.

You have read me refer to the Fed as being in a box several times now. Here’s why:

If they move just a bit and take away the emergency level of rates by increasing fed funds from effectively 0% to 1.00% the members of the FOMC worry it will cause another round of housing damage – as well they should. (I do wish they would get to it and do this, it will cause some pain, but the longer they wait the more economic damage that will result. And just maybe a move to 1% fed funds will cause long rates to decline a bit, or at least hold steady, as the bond market sees a Fed that is at least offering a token gesture toward price stability.) Conversely, if they don’t move, and their latest comments seem pretty crystal clear that they won’t for some time still, then commodity prices will trend higher.

One of the more important commodities is wholesale gasoline, and it just broke the $2.08/gallon level – a level that had provided resistance, bumping against this mark three times since June but not surpassing until this week. The current price of $2.13 translates to roughly $2.75/gallon at the retail level (there is normally a 60-cent spread due to fuel taxes, transportation costs and profit margins). We’ll watch this price closely now as a move to the $3 handle is likely to cause issues for a consumer that already faces plenty of headwinds.

Have a great weekend!


Brent Vondera, Senior Analyst

Thursday, January 7, 2010

Daily Insight

U.S. stocks bounced above and below the cut line several times yesterday, eventually rallying just enough in the final minutes for the broad market to close fractionally higher – the NASDAQ Composite failed make it back to the black but its holding on to most of Monday’s big gain.

The day’s economic data wasn’t enough to give the market a clear directive as the latest releases on housing and the service sector were not compelling.

The dollar moved significantly lower, with most of its decline occurring after the minutes from the latest FOMC meeting showed interest among some policymakers in expanding their mortgage-security purchase program. Print more dollars…well that’s so 1980s, they actually electronically deposit the funds into accounts. Either way it’s all the same, dramatically increase the supply of something and the price will trend lower.

Basic material and energy shares helped to buoy the market. The index that tracks material shares gained 1.52% and energy shares rallied 1.03%. Crude prices rose to the $83 handle even as the weekly energy report showed stockpiles increased 1.3 million barrels -- expectations were for supplies to fall 1.6 million barrels. Such a substantial difference would have normally sent crude price lower, but the lower dollar drove the trade in the pits.

Market Activity for January 6, 2010
Mortgage Applications

The Mortgage Bankers Association reported that its mortgage applications index rose 0.5% in the week ended January 1 after two weeks of large declines – apps slid 22.8% in the prior week and 10.7% the week before that.

Purchases rose 3.6% in the latest week after declines in the previous two weeks of 4.0% and 11.6%, respectively. Refinancing activity fell 1.6%, which also followed big declines in the prior two weeks – down 30.5% and 10.1%

The rate on the 30-year fixed mortgage rose to 5.18%.

Weak Moves into the Paint Get Rejected

You may have noticed the tariffs Washington is levying on Chinese steel. Well, the old Chinese may come back with a little counter of their own by further reducing their purchases of Treasury securities. The disturbing policy events just keep building; I don’t think Washington wants to get into this game of chicken right now. Picking trade fights is a very dangerous endeavor, especially so during a time of economic fragility – in addition it increases costs upon an already burdened consumer. But the degree to which such activity can adversely affect things is heightened that much more as we engage in massive deficit spending. The last thing we want is to do is something that may curtail future bids for government debt.

When the Fed fully completes their $1.25 trillion in mortgage-backed security (MBS) purchases that is going to reduce demand for government debt as well – as PIMCO has explained, they and others are selling their MBS to the Fed and buying Treasuries with the proceeds. The Fed’s printing press strategy is providing the demand for the Treasury market and keeping rates low. So that’s one demand source that will evaporate (if the Fed doesn’t come back and buy up even more MBS when housing runs into trouble again post April). Implementing policies, such as disputes with trading partners, that could cause other sources of funding to disappear will sting.

Some of you may have noticed that earlier this week China pulled a Dikembe Mutombo and stuffed U.S. attempts to levy sanctions on Iran – I’m sure the tariffs on Chinese steel made their decision that much easier.

ADP Employment Change

The preliminary employment report out of ADP, the business outsourcing solutions firm, estimated that 84,000 jobs were cut in December. This is quite a bit worse than what the market expects via Friday’s official jobs data, which is for no change -- and many expect a mild increase.

ADP has been off by a large margin lately, overstating the employment losses by roughly 100K per month on average since August, prior to that ADP was doing a pretty good job of predicting the jobs data when the labor market was in full-fledged freefall late-2008/early-2009. As a result of the degree of inaccuracy of late, I’m not sure what good the ADP numbers are right now, but we’ll go over them quickly nonetheless.

On the headline number, the 84,000 decline in private-sector payrolls ADP expects is the smallest rate of decline since March 2008.

In terms of industries, ADP has goods-producing sectors shedding 96,000 for the month, which is a significant deterioration (if accurate) as the official numbers had these payrolls down 69K in November. (Goods-producing, manufacturing and construction, jobs have shed 3.5 million positions over the past two years – most of which are permanently gone or will take a long time to come back. The auto sector alone has slashed 840,000 and construction 1.5 million. The auto jobs are permanently gone as the industry had been living with bloated expenses as if the Big Three had hopped into the DeLorian and traveled back to the 1950s; some significant percentage of construction jobs have been eternally extinguished -- until at least the next housing bubble arises, which will be a while. Of course, we could create – I don’t have a number, but a lot – of high-paying manufacturing jobs if we implemented a sensible energy policy that tore down omnipresent restrictions. But this appears to be heresy to too many people, so scratch that repulsive thought.)

The service-providing sector actually added 12,000 positions in December, according to ADP. This would also show deterioration as the official data had 58K added within the service sector in November.

We’ll see how it turns out when the Labor Department releases the figures on Friday. We’ve talked about how monthly job growth will emerge over the next few months, a point we first mentioned following the October jobs data. It may be a little too early to expect a boost in jobs for December, but February and March should be good to go for a positive reading. And expect some big numbers via government employment, especially as they add 2010 census workers. From there it will take 100K-plus per month for an extended period to slowly bring the jobless rate lower.

ISM Service-Sector

The Institute for Supply Management’s latest gauge of service-sector activity was pretty much a snorer, and failed to confirm a rebound has taken hold within the service-providing segment of the economy. The index came in at 50.1 (50.5 was expected) for December after slipping to contraction mode in November with its print of 48.7. The line of demarcations between expansion and contraction is 50.
With all of the talk about the V-shaped recovery, one would think ISM Service would be able to at least hit 52 and hold there – this is the average for the 2002 period, which was when the recovery from the 2001 downturn began and it was a weak one with just 1.95% GDP growth for the year. (When things really began to accelerate in 2003 – 3.85% GDP for the year – ISM Service averaged roughly 55.) Unfortunately, this data only goes back to 1997 so we can’t match against other expansions.

The best part of the report came via the inventory measure, which moved to expansion mode for the first time since August 2008 -- just before the credit trouble deteriorated to crisis mode. The figure came in at 51.5 and does offer some hope that business confidence within the service sector improved.

Ben Gay

The FOMC released the minutes from their December 16 meeting but these notes are becoming less useful as the Bernanke Fed offers more updated messages via speeches. We’ve talked about this for some time and there is zero doubt that Bernanke uses speeches as his primary beacon with which to send the market signals as to their latest views.

The latest signals have come via the three speeches delivered early this week (Bernanke and Vice Chairman Kohn addressed the American Economic Association on Sunday and Fed Governor Duke followed up with her comments to the Economic Forecast Forum on Monday. They were all very dovish, expressing the need for policymakers to keep the emergency level of rates in place to support the financial sector, housing, and the economy in general.

The only additional news the minutes provided, as touched on above, was that a few policymakers favored increasing and extending asset purchases – and some people think the financial system, the housing market and economy have healed? Only looks that way because of massive support, the economic crutches the government has provided. If the economy were in normal recovery mode then would there be any discussion of extending quantitative easing (QE), policy that will make things much more difficult for when they do eventually have to unwind it all?

“It might become desirable at some point in the future to provide more policy stimulus by expanding the planned scale of the large-scale asset purchases and continuing them beyond the first quarter,” as the minutes showed some FOMC members suggested. They don’t exactly sound sanguine. Rather, some members appear to be pretty worried what happens to housing and the banking system when the Fed stops buying securities.

For new readers I’ll repeat, the Fed is in a box. If they stick to the current QE (asset purchases) expiration they know yields will rise, another round of difficulty housing will endure and the likely damage to riskier asset prices. But if they extend QE for fear of this all the US $ will test its very near-term lows and possible the all-time nadir, commodity prices will continue to move higher and possibly unmoor inflation expectations. While nominal stock prices may continue to go higher for a while, even a stock market that is jacked up on easy money will have to respond to the other damages a ballooning Fed balance sheet (money printing) will have on longer-term economic conditions. It’s quite a quandary they find themselves in.

What is for sure, Helicopter Ben is living up to this pejorative name some have given him. (The name arose from his 2002 speech about deflation in which he stated the government can produce as many U.S. dollars as it wishes at no cost. Maybe a more appropriate term for Bernanke, if they do go and extend QE, is B-29 Bomber Ben – or more concisely put: Ben Gay.


Have a great day!


Brent Vondera, Senior Analyst

Wednesday, January 6, 2010

Daily Insight

U.S. stocks struggled for most of Tuesday’s session after a much-worse-than-expected pending home sales report showed the underlying fragility of housing; however, the broad market did manage a decent gain and the NASDAQ Composite rallied in the last half-hour enough to eke out a fractional gain. The housing weakness boosted the view that the Fed will keep rates floored for quite a while still – I know we keep talking about this but it remains such a huge theme for traders that it must be mentioned.

The latest factory orders data showed very nice activity occurred in November, but it’s not enough to offset the housing news and begin to worry those in riskier assets that the Fed is about to begin the Great Unwind. I for one want to believe this manufacturing rebound is for real, but it seems so transitory – beefed up by auto assemblies that are likely to be short-lived and housing construction that looks ready to roll over again. Electronics production, which may be the only lasting story as firms must at least manage business-equipment orders to maintenance levels and even maintenance levels of purchases looks good compared to where we’re coming from, also boosted the factory orders data.

Everyone understands, or should, that housing is a central issue for the banks and that is going to keep Bernanke & Co. frozen from even gently raising short-term rates – unless forced to by the bond vigilantes pushing the long-end of the curve higher. The industry has to deal with very deep credit issues such as high credit-card and mortgage delinquencies. If home sales retrench again that will put pressure on prices and lead to additional loan problems for the banks.

Remember, we have three-seven million properties that are going to enter supply (the low end of that estimate would double the current homes available for sale figure) as the foreclosure process has been delayed due to mortgage modifications that are proving to be counter-productive. Any trouble on the sales front is going to exacerbate this situation. On top of that, there are roughly 25% of mortgages underwater (higher than the property’s value), with 5.3 million borrowers at least 20% underwater, according to industry analysts. One has to expect that at least a significant number of these troubled loans are going to be foreclosed upon. It is difficult to see how credit is going to expand; certainly it appears that lending has no business expanding until the delinquency and default rates begin to trend lower.

Treasury security prices rallied hard, the yield (which moves inverse to price) fell 6 basis points to 3.76% as there was some run to safety.

Market Activity for January 5, 2010
Factory Orders

The Commerce Department report good news in that factory orders rose 1.1% in November, double the expectations of a 0.5% increase.

New orders for manufactured goods have now risen seven of the last eight months. Excluding transportation, new orders increased 1.9%. New orders for durable goods (those meant to last at least three years) are up two of the past three months, increasing 0.4% in November – unchanged from the previously published increase via last week’s durable goods orders reading. Computer & electronic products, also up two of the past three months, showed the largest increase of all segments for the month, surging 4.9%.

Inventories of manufactured goods were up 0.2%, marking the second month of increase. Inventories of durable goods fell though for the 11th consecutive month, down 0.3% -- transportation equipment inventories fell 0.4%, leading the decline in durable stockpiles. Stockpiles of nondurable goods rose 0.9%, the second month of increase – led by a 4.2% rise in petroleum and coal products, so there is a little depressed demand factor in this reading.

The only real negative in the report came by way of the unfilled orders figure, down 0.7% for the month – lower for 14-straight month, the longest stretch since this data began in 1992.

Pending Home Sales

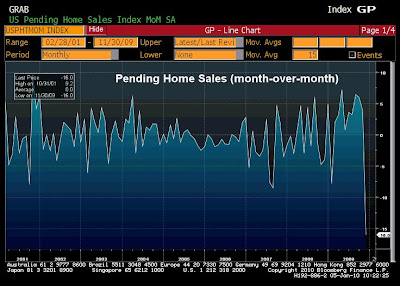
The National Association of Realtors reported that pending home sales got slammed in November, falling 16% compared to October’s activity – the first decline in 10 months. The number was expected to decline just 2.0%. This plunge will show up via existing home sales for part of December, but mostly within January’s results. Pending home sales are contract signings for previously-owned homes. Those sales are not officially counted until the contracts close; the signing to close process is taking about six weeks on average.


It was unclear to home-borrowers, prior to the November 4 promulgation, whether or not the tax credit would be extended so there was a rush during August, September and October to get in before the deadline, which caused a respite in sales that may extend for a couple of months – it pulled sales forward. If existing home sales officially drop by this degree that pending sales is predicting (official number is released January 25) it will erase the boost that’s occurred over the previous two months, and then some.

We should see sales rebound by early spring as that subsidy has been extended through April, although I’m not sure one should expect the tax credit to invigorate sales to the degree it did the first go around. What this pending sales data for November suggests is the degree to which sales will decline post-April 30 when the credit expires. What we are doing, just as is the case with all of the other government support, is delaying the inevitable.

By region, the Northeast and Midwest were the hardest hit as contract signings fell 25.7% in each location. The South saw contract signings decline 15%. The West held up very well, as pending sales fell just 2.7% -- this is the area with the most distressed properties and since these properties have accounted for a third of all sales over the past few months the relative out-performance for the region should not be surprising.

From a year-over-year perspective, pending home sales are up 25.1% in the West, up 21.3% in the Northeast, up 17.1% in the South and higher by 14.2% in the Midwest.

Vehicle Sales

Total U.S. vehicle sales came in better-than-expected for December, registering 11.23 million units at a seasonally-adjusted annual rate – 11.00 million was expected. For the year, vehicle sales finished at 10.425 million, down 21% -- the lowest annual figure since 1982. The year ended a heck of a lot better than things looked just a few months back, but dealers offered large incentives, interest rates remained extremely low and loan-to-value ratios were obscenely high – 93% as of the latest consumer credit data.

Ford’s sales jumped 32% during December from the year-ago level (down 15.4% for all of 2009) as the firm has seen a nice turnaround of late thanks to good products and possibly buyers’ attraction to the only U.S. maker that refused to take a government handout. GM saw sales fall 5.6% for December, even as they offered the deepest discounts. GM’s sales fell 29.7% for all of 2009.

Honda and Toyota made a good run of it in the final months of the year, but even those names saw sales fall 19.5% and 20.2%, respectively for the year.

Have a great day!


Brent Vondera, Senior Analyst

Tuesday, January 5, 2010

Daily Insight

U.S. stocks rallied on the first trading session of the year as traders returned to work with a sense of euphoria. Oh, and a speech by Fed Chairman Bernanke on Sunday to the American Economic Association suggested that the easy-money train will roll on for quite a while. Barton Biggs summed it up well while explaining his bullish fervor: “I don’t know what’s going to happen in the second-half of [2010]. I’m just saying that in the next three to six months the economy is going to keep recovering and stocks are going to go up again.” The bulls may be more short-sighted than anytime in the past 30 years.

Yesterday felt a lot like the final three quarters of 2009 as the same trades prevailed: stock, commodity, Treasury prices all up; the dollar down.

The day’s economic data was mixed as the latest manufacturing report posted its fifth-straight month in expansion mode, while the latest construction-spending reading fell for a seventh-straight month.

Crude oil rose well into the $81 handle yesterday on a combination of events: very cold weather across the country, an array of pretty strong global manufacturing reports and the Bernanke speech.

(I found it interesting that the Shanghai market closed lower by 1% during their Monday session even after another good factory report from that country – another sign that what’s good is bad as stock prices around the globe are being fueled by rock-bottom interest rates. This conditioning, also particularly true for the housing market, may just cause more troubles than would otherwise be the case when rate rise even mildly from these levels.)

Market Activity for January 4, 2010
Maybe the 2012 Prediction Isn’t So Crazy (No not that the world will end, the other prediction)

As mentioned above, Mr. Bernanke delivered a speech this past weekend in which he stated that regulations must be used to prevent bubbles, Fed tightening is just an “option.” Does this mean he’s setting the tone for the Fed will wait a very long time before they begin to unwind the unprecedented monetary easing policy that remains in place? Does this give credence to Federal Reserve Bank of St. Louis President Bullard’s prediction that the FOMC (also an estimate by Goldman Sachs) won’t raise fed funds until 2012?

He certainly denied that interest rates were the cause of the housing bubble, not the first denial as he’s stated this before. If interest rates didn’t cause the housing bubble, or more appropriately termed the debt bubble, I don’t know what did. He says it was a lack of regulation and the monitoring of this regulation but while some regulation is necessary it has never stopped crises. Besides, the lack of lending standards follow borrowing excesses, they don’t cause them. Undoubtedly, very easy credit certainly exacerbates things but extremely low interest rates for a long period of time is the origin. It is a very low interest-rate environment that gets the ball rolling.

The Fed needs to understand that human nature goes wild when incited by bad policy decisions by the FOMC – like consumers and institutions are not encouraged to take on more debt when fed funds is below the rate of inflation? Please. Everyone wants in when money is “free”, and it was essentially free when one could get an ARM at close to zero in real terms.

And it would be wrong to let Congress off the hook. Rolling the dice, to paraphrase Barney Frank’s now famous words, with Fannie and Freddie and many years of prodding lenders to extend credit to high-risk borrowers is another major cause of the problems we now face. The alternative mortgage products that Mr. Bernanke cites as “quite important” and “a key explanation” for the housing mess were created in response to pressures from Congress to boost home ownership. Congress had absolutely no problem with loans that minimized payments to the detriment of principal and dispatched the down payment, in fact they encouraged it…until home prices began to fall and these mortgages (turned into investment securities) became toxic. Again though, without super-low interest rates there is no incendiary device.

The fact that the Fed fails to understand this (or is it just that they are unwilling to raise rates even a smidge because they know the additional burden that will result with regard to servicing the massive debt the government is incurring) means that they should be stripped of their interest-rate mechanism; the market needs to determine rates if the Fed is going to deny such obvious connections. There is no doubt that debt bubbles, misplaced assessments of risk and commodity-price spikes are directly associated with excessively easy monetary policy. To deny this reality is like obstinately arguing the universe is geocentric. Of course, Galileo was eventually vindicated; the universe is indeed heliocentric. It’s only a matter of time Mr Bernanke.

ISM Manufacturing

The Institute for Supply Management reported their gauge of manufacturing activity accelerated to 55.9 in December from 53.6 the month prior. This marks the fifth-straight month in which the index has remained above 50, the line of demarcation between expansion and contraction. The six-month average is 53.3, a level that some say predicts GDP growth of close to 4% if it holds there for another six months. The question is whether it can hold this level once stimulus spending begins to wane in the 2H 2010.

The internals continue to look good-to-strong in most cases. The new orders index jumped to 65.5 from an already hot 60.3 in November. Backlog orders slipped to 50.0 from 52.0, but remains at that cut line – this is one of those readings we’ve been talking about needs to remain in focus; if it fails to remain in expansion territory for an extended period it will signal current factory workers are not stretched and thus there will be no need to hire additional workers. Supplier deliveries, another gauge of resources becoming stretched, accelerated to 56.6 from 55.7. The employment index rose to 52.0 from 50.8, now three months above 50.

The worse aspects of the report were the inventory gauge, prices paid and eroding breadth.

The inventory reading remains negative. It rose in December, but only from a depressed reading of 41.3 and the 43.4 print for December does not show business confidence has improved much – the six-month average is 40.3. One shouldn’t expect this reading to blow through 50 but until it moves to the high 40s it will signal a lack of business confidence. (When firms become confident they will happily boost inventory levels.)

The prices paid index moved to 61.5 from 55.0; the six-month average is 60.8 – this will put pressure on profit margins and thus force managers to stretch existing work loads more than would otherwise be the case.

Lastly, I can’t help but notice that among the 18 industries that ISM tracks, the number reporting growth has declined for two months – down to 12 from 13 in November and down to 9 from 12 in this latest report for December.

Construction Spending

The Commerce Department showed that construction spending fell for a seventh-straight month in November, down 0.6% for the month. Private-sector residential construction fell 1.6% for the month and the commercial side was down 0.2%. Public-sector spending was of little help for the month as federal and state spending on commercial projects slipped 0.4% -- public-sector residential construction rose 1.2% in November, but this is segments accounts for just 1% of the total number. (For clarity, private-sector residential spending accounts for 30% of all construction spending; private and public commercial outlays makes up roughly 69% of the total number -- 35% from the private sector and 34% from the government.)

Many have counted on residential construction to contribute nicely to fourth-quarter GDP based on a 4.5% jump from the private sector in October. These latest results reduce that good start to the quarter. The housing starts data for November suggest a good reading for December, but with the weather we’ve run into it doesn’t look like this will come to fruition.

Have a great day!

Brent Vondera, Senior Analyst

Monday, January 4, 2010

December 2009 Recap

The Santa Claus Rally helped equity markets advance in December as did better-than-expected economic data and news that major recipients of TARP (Bank of America, Citigroup, Wells Fargo) will be able to repay the government.

The U.S. dollar made a drastic reversal early in the month on signs of improving economic data, most notably an encouraging November nonfarm payrolls report, which gave credence to the idea that the Fed will raise interest rates sooner than the market expects. The stronger dollar sent commodities, especially gold, lower. Meanwhile, the tight negative correlation between stocks and the dollar over the past several months seemingly weakened.

Riskier, or more volatile, asset classes made the biggest gains during the month. Both mid caps (represented by the S&P 400) and small caps (represented by the Russell 2000) outperformed of large caps (represented by the S&P 500) in December and all of 2009. After dominating all other asset classes in 2009, emerging markets continued to outpace large cap stocks in both domestic and foreign developed countries.

It should be little surprise that Information Technology and Consumer Discretionary were among the top performing sectors in December. The other top performing were Utilities and Telecommunication, which both benefited from investors seeking dividends amid low (virtually zero) yields on money-market funds and CDs.

The worst performing sector was Financials. Mega-banks repaying TARP funds is a reason for optimism indeed. But banks pressured prices by flooding the markets with new equity issuances to replace TARP capital. Also weighing on financials was the prospect of the Fed raising interest rates. Financials have greatly benefited from easy profits made by borrowing virtually interest-free capital and buying Treasurys to earn a risk-free rate.

Bonds finished the year with their worst month since October of 2008. The Barclays Aggregate Bond Index declined 1.88 percent in December. Treasurys took the brunt of the damage as heavy supply overwhelmed short-staffed trading desks that struggled to take bonds down. IEF was down 4.39 percent in December and 6.60 percent for the year. Credit and MBS outperformed Treasurys for the month, as did TIPS, which returned -2.09 percent.

--

Peter J. Lazaroff, Investment Analyst
Cliff J. Reynolds Jr., Investment Analyst

Fixed Income Weekly

Risky assets, including stocks and corporate bonds, experienced a substantial recovery in 2009. The same investors who flocked to Treasurys at the height of the credit crisis in 2008, shunned them for riskier investments as the panic subsided. The Fed kept policy ultra-loose throughout the year and kept rates very low, buying $1.086 trillion in Agency MBS and $300 billion in Treasurys through their quantitative easing programs.

A graph of where we stand rate wise. (intraday 12/31/09)


Treasury Issuance
Heavy supply concerns dominated much of my commentary during 2009, but supply actually had very little effect on the rate environment. The Treasury auctioned just under $2.2 trillion in coupon Treasurys in 2009 ($2,195,836,163,400 to be exact). That was a 113% increase from the year before and growth is showing no sign of stopping in 2010. Claims that the US will soon be replaced as the world’s reserve currency were also prominent this past year, causing many to think that the abundance of foreign buyers of US debt will soon be a thing of the past. But the US relies on foreign buyers of debt no more than those same countries rely on the strength of the Dollar to support their export dominated economies. So don’t expect radical changes to the landscape any time soon.

Credit
Investment grade credit was outdone only by non-investment grade credit in 2009. CSJ (1-3 year credit) outperformed LQD (12 year credit) on a price only basis due to rates moving higher, but LQD barely beat out CSJ when you factor in interest income. For 2009 CSJ was up 3.09% price only and 7.08% total, while LQD was up 2.46% and 8.46% respectively. They both massively underperformed HYG (High Yield Corporate Bond) which returned 28.5% in 2009.

This year’s strong rally in credit was still only a partial reversal of damage done in 2008. By most measures credit spreads are sill wider than they were before the crisis began, but absolute yields are still lower, which is very accommodative to corporations looking to borrow.

Credit Default Swaps, which are used as insurance against a default, followed the rally in corporate bonds in 2009. According to Markit the cost of default protection on a broad basket of corporate debt fell 63% in 2009 to 85 basis points. The cost is quoted as an annual payment based on a percentage of the the notional amount insured.


2010?
So what’s in store for bonds in the New Year? The Fed still has about $200 billion in MBS to purchase, which should be completed by March. Expectations for Treasury issuance in 2010 vary from “as much as humanly possible” to “even more than that”, and rates are likely to edge higher throughout the year as the fed begins to signal a policy reversal in the second half of 2009. Fannie and Freddie are all but entirely owned and run by the Government, so subsidies to homeowners will likely continue even after the tax credit expires at the end of April and the credit quality of their bonds will likely continue to move closer to that of Ginnie Mae. And based on Bernanke’s demeanor and the Fed’s recent language my expectation is for them to move more than 25 basis points on the Fed Funds Target rate (to .75% maybe?) by Q3 2009 (at their September 21st meeting maybe?) after removing the remainder of their emergency liquidity and repo programs by the summer.

Happy New Year Everybody!!

Cliff J. Reynolds Jr., Investment Analyst

Daily Insight

U.S. stocks went out on a bad note, apropos for the decade, as a second-straight weekly decline in initial jobless claims failed to inspire a rally. Treasury prices fell, moving the 10-year yield to the top-end of its six-month range (3.85%), and the price of oil inched closer to the $80 handle after sliding to $70 just two weeks back.

Activity was in super-sloth mode as less than 650 million shares traded on the NYSE Composite – about one-third less than what’s become normal on the last session of the year.

And speaking of the year that was quite a turnaround from the March lows. The broad market began the year lower by 25% just 46 sessions into 2009, but staged a dramatic comeback, jumping 67.4% from that point to recoup nearly 50% of the losses from the October 9, 2007 peak.

For the decade, the S&P 500 declined 24.10% in simple-price terms (down 2.71% annualized) and lower by 9.10% when including reinvested dividends (down 0.94% annually). On an inflation-adjusted basis, the decade in stockland was worse with the annual decline at roughly 3.5%, but this is just in terms of price and does not include the contribution from dividends. And worse still for the international investor as the dollar got clocked by 22.25%. (When the foreign investor converts back to his/her home currency, they received less of that currency.)

But what’s done is done, let’s look to the future. The multiple compression (decline in the market P/E) that’s occurred over the past several years makes the chances of strong returns for the new decade all the more likely. Of course, this is not axiomatic. For strong returns to materialize we must have sound monetary policy and a tax policy that incentives entrepreneurial endeavors, the investment that those upstarts need, and work over leisure. (We must also get much more serious about security.) The wrong policies will lead to another rough 10-year stretch, just ask the Japanese.

All was not totally lost over the past 10 years, a well-balanced portfolio that encompasses an array of asset classes helped. For instance, mid cap stocks rose 63.42% during the decade (up 5.03% annualized); small cap stocks added 23.90% (up 2.16% annualized). Reinvesting dividends into these indexes produced a 6.35% annual return for the mids and 3.55% per year for smalls. The main emerging market index was up 7.29% annually and bonds were obviously positive.

The CRB, which tracks a basket of commodity prices, rose 38.14% for the decade – most of the return was made by 2004. It’s been an especially wild ride for commodity prices since 2004 as the index was up as much as 130% since 1999 at one point during the summer of 2008 and flat for the decade as of February 2009. The CRB index was driven by copper (up 290%), gold (up 278%), and oil (up 210%).

Home prices, as measured by the median price for an existing home, rose 24% for the decade (up 2.25% annually).

Market Activity for December 31, 2009


Jobless Claims

The Labor Department reported that initial jobless claims continued to fall to that very important 400K level – a level that always signals at least some monthly payroll growth. Initial claims fell 22,000 in the week ended December 26 to 432,000. The four-week average declined 5,500 to 460,250.

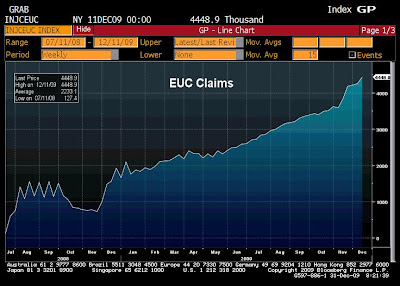
While the initial claims data show the pace of firings has eased greatly, the continuing claims data unfortunately show hiring has yet to take hold. Standard continuing claims (the traditional 26 weeks of benefits) fell 57,000; however, claims for Emergency Unemployment Compensation (EUC) more than offset this as they jumped 191,000. Until EUC halts its trend to new highs, there is no clue that meaningful monthly job growth has begun.


Outlook

Stocks

For 2009, the stock-market trade, at least post-February, was all about easy money and rock-bottom interest rates encouraging a move into risky assets as the hunt for return was on. The 2010 market should depend on profit growth (and it better be accompanied by some top-line improvement or the strong profit growth that will come in 1H 2010, enabled by massive cost-cutting, will peter out); it will take aggressive earnings improvements for stocks to withstand even marginally higher interest rates, if they are to materialize.

The Economy

U.S. corporations are the bright spot for this economy as they have locked in leverage at very low rates and sit on mounds of cash. (The same cannot be said, sorry to say, for households; and the government debt situation is a mess.) However, firms will remain chary with this cash as final demand will struggle to pick up – a function of high unemployment and exacerbated by the $500 billion, at the low-end of the estimate, in additional credit-card lines that will be erased in 2010.

One of the places business caution will continue to show up is in hiring. Yes, we’ll see monthly job growth begin within the next two months (something we first mentioned following the October jobs report), after shedding more than seven million jobs over the previous two years – 4 million gone in a six-month stretch, November 2008-April 2009. But the business side of the economy, and I’m talking in large part, is the only saver right now. Government is going hog wild on deficit spending and households are backing off from their hog-wild escapade of the previous several years. Businesses will also have to manage around what they estimate Washington has in store for them via higher tax rates and regulations.
Remember this: By the spring, hiring for the 2010 census will peak as 800,000 workers are needed for this endeavor, according to the government. This will boost the monthly job gains for a couple of months (showing up via a spike in government jobs) and lead to some euphoria, but shortly thereafter these people will be looking for work again – the census work is a six-week gig.

On banking, the 2010 economy will have to face a gathering pressure from the credit markets as banks will be forced to add to provisions due to still increasing delinquencies. This is simply a reality of the credit bubble that still must be dealt with, affecting the economy for a while still. And more to come as 25% of all mortgages are underwater and 5.3 million borrowers are 20% or more underwater – 2.2 million properties are worth less than half of the mortgage balance, according to First American CoreLogic – that’s really hard to believe but even if they are off by a long shot, you’re talking a real problem. (We must engage in the RTC-style program that TARP was originally sold to do – or let the market take care of it, but there is zero political will for this. The bad assets that still sit on bank balance sheets must be removed; the government can sit on these assets for several years if that is what it takes and sell them off when the time is appropriate. This should have been the main federal government response to this entire situation, that and slashing tax rates. Alas, we dropped that ball. The Bush Administration fumbled it big time and the Obama Administration ran with the darned thing, in the wrong direction.)

Another serious issue is the one that arrives when government intrudes on the private sector to the degree it is at the present. It sets up serious barriers to entry for upstart businesses. Who’s going to create the 100,000 jobs per month that it takes to just keep the unemployment rate from rising – the 300,000 per month it takes to move the jobless rate lower in a reasonable amount of time? (Maybe those numbers need to be even greater as a higher number of workers in their early 60s come to the cruel reality that they cannot retire yet due to the $10 trillion reduction in household net worth that’s occurred from the peak, making it more difficult for newer entrants into the job market.)

Why do you think that many of the CEOs of the largest U.S. corporations haven’t a problem with this government largess? They don’t because they have the resources to buy themselves handouts and government contracts, making it easier to manage around increased regulations and taxation – the government is picking winners and losers and some of the largest corporations are buying themselves into the winner’s circle. The smalls don’t have a chance in this environment and the big guys know it; they know it shuts out current and future competition. This is a problem that must be reversed. Small business currently accounts for 65% of job growth, get in the way of this engine and you get more crazy policies out of Washington as politicians scurry for anything that they believe will get them re-elected as the unemployment rate remains high. When Washington is this involved do not underestimate their ability to screw things up, royally.

The U.S. economy will emerge from this situation, but I fear the timeline has been delayed due to the government’s response. That response may very well have eased the degree of downward economic pressure, but always elongates the cycle to a full-fledged recovery. Sure, GDP will record 3-4 quarters of growth, with a couple of these being above-average results as the inventory dynamic adds 1.5 -2.0 percentage points to growth and government infrastructure spending peaks in 1H2010, which may add another percentage point. There may even be a 6% GDP quarter in the cards, possibly in Q2, as those refundable tax credits for first-time homebuyers are collected and propel consumer spending. Enjoy it while it lasts as 2H2010 may very well show the rebound to be especially transitory. Expect something in the manner of 3.0%-3.5% GDP for all of 2010, almost all based on stimulus and a transitory inventory rebuild.

I hear economists talking about how strong 2010 is going to be. You’ve heard it plenty of times now: “The deeper the contraction, the stronger the upswing.” For this to result, we’ll have to see 7.75% GDP growth for the entire year in order to compare with past rebounds from the worst recessions of the postwar era – doubt that’s in the cards. One reason for the doubt is that I’m mindful past postwar-era recessions were simply driven by the inventory cycle. That is, as manufacturing stockpiles became bloated the economy had to wait for the next production surge as those inventories needed to be sold off first. But those past recoveries had the luxury of relying on an expansion of credit to offset the organic weakness. Not this time; no such luxury – households don’t have the capacity with the household debt/disposable income ratio at 123%. Notice in the chart below that with each recovery during the past 30 years the household debt/income ratio kept rising, spiking to the insane level of 130% as the Fed induced such behavior with its very low interest-rate environment 2002-2005.

Besides, let’s be serious about how we define a strong expansion, we’re talking about business cycles here. You’ll hear most of the optimists effuse positively about 2010, but express concern over 2011. The average business-cycle expansion over the past quarter century has lasted roughly eight years on average. One year of growth is not an expansion; more frequent downturns is not a positive development. It will take a significantly higher than average growth rate for a prolonged period to bring back the jobs that have been extinguished over the previous two years. Without a durable recovery, the household-debt pay down process will take longer to play out.

I guess an outlook would be remiss to not even mention geopolitical concerns. I’ve spent so much time on this subject over the past few years, I’ll keep this topic short. At some time, and the clock is ticking, someone will have to deal with Iran’s hell-bent desire to weaponize nukes. If the Revolutionary Guard doesn’t put down their guns and stop shooting student protesters (which there is a chance of this happening, just remote), or the U.S. doesn’t take out/seriously delay the regime’s nuclear capability, then Israel will do it. Beyond thinking about its survival, Israel also must worry about capital flows to the country. If investors believe that Iran is two years from a bomb, they won’t wait to pull capital from Israel until that date arrives, they’ll do it much sooner. Israel will be forced to act for a number of reasons.

So there are a lot of headwinds out there, but assuming a geopolitical event or large-scale domestic terrorist attack does not occur, we should get a short-lived bounce in economic growth. While things may very well take longer to return to normal, we will get past this trouble. When the Fed normalizes interest rates (either voluntarily or by force via the bond market) this will drive the final leg of the de-leveraging process. That is when a durable economic expansion will emerge from the next downturn – the kind of expansion that we’ve become accustomed to; the kind of expansion that this great country is capable of producing. A durable economic expansion will emerge in time, but it is likely to take an extended period.

One year closer to normalcy, as Truman would have put it.


Have a great day!


Brent Vondera, Senior Analyst