Visit us at our new home!

For new daily content, visit us at our new blog: http://www.acrinv.com/blog/

Monday, November 23, 2009

Daily Insight

U.S. stocks closed lower for a third-straight session on Friday, but again pared about half of its early-session losses in the final two hours of trading. Stock got off to a poor start as overseas bourses closed their session lower. A huge earnings miss from Dell Inc.and a larger-than-expected loss from homebuilder D.R. Horton didn’t help matters.

Comments made by European Central Bank President Trichet on Thursday night, in which the central banker stated policy makers will gradually withdraw emergency cash, hurt stocks overseas and that again flowed into U.S. trading. The market is not even close to wanting to hear these types of comments. Nevertheless, it is exactly what central banks need to be doing. (Although, St. Louis Fed Bank President Bullard last night, stating he hopes the U.S. central banks will extend its mortgage-backed security purchase program has stock-index futures sharply higher this morning.)

The global economy is not in a position to stand on its own and resume anywhere near normal growth, but you’ve got to allow the market to continue to wash out excesses and the miscalculation of risk that occurred via the previous loose money campaign. The current prolonged period of aggressive monetary stimulus is beginning to create other problems and it’s just not the rock-bottom level of rates but also other liquidity measures to banks. Just like intense government involvement, it may make things appear better than they are in the short term but it prolongs the economic damage. We’re seeing evidence of monetary policy exacerbating credit contraction, greatly endangering credibility regarding currency stability and leading to early-stage asset bubbles particularly in Asia (specifically, investors borrowing cheap dollars, converting to other currencies and buying assets in those countries).

Energy, tech and financial shares led the market lower on Friday. The traditional areas of safety – health-care, utilities and consumer staples – were the only sectors out of the top 10 groups to close higher on the session.

For the week, the broad market ended essentially flat, down just 0.19%, as the final three sessions of the week erased Monday and Tuesday’s gains.

Market Activity for November 20, 2009
The Greenback

The dollar is getting hammered this morning, looking to move to that 74 handle on the Dollar Index again, due to the divergent statements between Trichet and Bullard. If the European Central Bank is really going to begin a mild tightening campaign (removing the emergency level of stimulus) and it’s just not talk, while our Fed is going to keep the pedal to the metal, possibly even expanding its quantitative easing campaign, the U.S.dollar will make a new low.

The greenback will find some support via Asian countries forced to buy dollars as the Chinese yuan continues to get de-valued against the currencies of its Asian neighbors (as it is pegged to the U.S. dollar). Thailand, South Korea, Vietnam et al., will seek to de-value their own currencies so not to lose too much export activity to the Chinese. This is all due to the Fed’s policy.direction. It’s a race to the bottom, and a trend of currency de-valuation is not a good sign for global growth. To the contrary, it is a recipe for turmoil. But this dollar support will prove temporary. The longer-term trend of the dollar is almost completely a function of monetary policy – it ultimately depends on how long they remain hooker loose.

Gold has made a new nominal dollar high this morning, up $20 to $1,166/oz (the inflation-adjusted high is roughly $2,200/oz., hit in 1980). The metal is up 59% since the S&P 500 hit its all-time high of 1565 on October 9, 2007.

The Fed and Independence

There’s a lot going on in Washington, which we’ve been talking about on a weekly basis – you can never separate economic developments from policy, and this is especially so today. The latest is this bill to make the Fed’s actions more transparent.

The House Financial Services Committee advanced a proposal to remove a 30-year ban on audits of monetary policy and engage in examinations of central bank actions.

There are many people in an uproar over this development as they believe the ideas in this bill will compromise the Fed’s independence from Congress. Well, welcome to the arena of concern; Fed independence, or lack thereof, appears to have been jeopardized for over a year now. I guess it takes intensely conspicuous acts to wake people up to the fact.

The reaction seems to be a bit carried away though as the process is in the earliest stages and the entire proposal is not all bad if it’s massaged a bit.

First, it is likely to be diluted as, if, it ends up flowing through the legislative process. It must first pass a vote in committee, then must be approved by both the House and the Senate, and then of course signed by the President.

Second, the Fed can inform Congress of its actions, such as emergency loans to specific banks and institutions, so long as there is a significant lag (say, 2-5 years). This is the case in terms of some other things the Fed does. We just cannot make the information immediately public as it may result in a run on specific banks, or develop into other situations that potentially cause widespread panic.

So that’s the part of the bill that isn’t all bad if a bit of common sense is incorporated. The very bad part of the bill is this idea that the GAO (Government Accountability Office, formerly known as the General Accounting Office) would be able to criticize or even have a role in determining monetary policy. This would paralyze the decision making process. (Some people may see action to paralyze the central bank as a good thing, frankly I’m not going to offer an opinion on this right now because things have not yet progresses to a point in which the opinion would seem anything other than outrageous – in time we’ll be able to discuss, I’m pretty confident of that.) Anyway, at this point in time, the Fed cannot be paralyzed and adding another set of players to the mix will probably do much more harm than good.

So we’ll see how it turns out. In general though, it sure doesn’t seem the Fed is nearly as independent from the political process as it should be. I’m frankly concerned that the Fed has been roped into monetizing the debt (keeping rates grounded and devaluing the dollar) as this makes it easier for the government to manage massive levels of deficit spending – the interest payments are lower than they otherwise would be and you’re paying debts back with dollars that are worth less. Of course, it leads to many problems down the road.

Week’s Data

We were without a data release on Friday but this week will be a big one even as it is cut short by Thanksgiving Day.

On Monday we’ll get existing home sales (October), the data is expected to show a 2.3% increase as first-time buyers rushed in during the first half of the month to get in before the tax credit deadline (that credit has been extended but as of October it was uncertain). If the number misses it will be a big market downer as it is abundantly clear the November reading is going to show decline.

On Tuesday we get the first revision to Q3 GDP and the CaseShiller Home Price Index (September). GDP is expected to be downwardly revised to show the economy expanded at a 2.9% real annual rate – originally estimated to have grown 3.5%. CaseShiller has a large lag to it (being September data) but is still heavily watched nonetheless. It should show prices rose for a fourth-straight month for the 20 cities the index tracks. The year-over-year reading should show prices declined at a reduced rate, which would extend upon the five-month trend. We’ll also get consumer confidence (November). The reading has been falling for three months and currently sits at a level that is the low point for every recession since 1967.

On Wednesday we get personal income and spending (October), durable goods (October) and initial jobless claims (pushed up to a Wednesday due to Thanksgiving). Personal income is expected to rise 0.2% after unchanged for September and spending is expected to rise 0.6%. Spending will be boosted by durables, which were driven by auto sales as they bounced off of September’s very weak car sales. Initial jobless claims are expected to fall 5K to 500K. If accurate, it will mark the first time the reading touches 500K since falling to 488K in early January. We’ll be watching for the increase in extended jobless claims as this will be the first week in which the latest French-style extension takes effect – up to 99 weeks of benefits now.


Have a great day!


Brent Vondera, Senior Analyst

Friday, November 20, 2009

Fixed Income Weekly

Short-term yields continued their march downward this week mostly driven by comments from St. Louis Fed President James Bullard. Headlines read “Fed will not increase rates until early 2012”, but were pretty misleading if read without the rest of the speech.

Below is a graph of the current on-the-run 2-year since it was issued late last month. Yesterday the 2-year tested the all time lows of .649% set in late 2008.


The majority of the Fed President’s speech focused on monetary policy going forward, namely the status of quantitative easing and near zero fed funds. Bullard prefaced the quote that ran across the newswires by sighting that the Fed has waited 2.5-3 years from the end of the past two recessions to begin raising interest rates, which would give us an early 2012 initial interest rate hike if the Fed decided to follow similar protocol. Problem is, this is no normal recession and the Fed has chosen to fight the deflationary threat to the economy in non-traditional ways (i.e. QE).

Instead of waiting for an initial hike from current levels 2.5 years from now, a scenario where the Fed moves to more of an accommodative policy within a year while beginning to test the securities market with reverse repos to unwind the QE is more likely.
Early year-end profit taking may have been another factor pushing the short end lower this week. According to Bloomberg, 3-month bills traded as low as .005% on Thursday and stayed that low all day Friday, likely due to managers moving to the sidelines through the holiday season and year end. Stocks are down a little for the week so this seems like a logical thought at least.

The last time bills yielded below .05% was in the aftermath of the Lehman Brothers bankruptcy which forced The Reserve Fund (a major money market fund who held a concentrated position in commercial paper issued by Lehman) to break the buck. This forced an exodus of cash from mmkt funds into bills, sometimes accepting negative yields in order to do so. We are in same place now for a different reason. Now more than ever, the Fed’s liquidity is urging investors to love risk again by punishing them for hoarding cash.

Cliff J. Reynolds Jr., Investment Analyst

Daily Insight

U.S. stocks lost ground on Thursday, following a slide in overseas bourses. A bout of concern that stocks have gotten ahead of economic growth prospects (we’ve heard that one before only to see stocks resume rally mode) and an analyst’s downgrade of the semiconductor space resulted in some profit taking.

A round of economic data didn’t help matters as initial jobless claims refuse to fall below the 500K level and mortgage delinquencies and foreclosure rates continue to rise – although high jobless claims and terribly elevated foreclosure rates haven’t had an adverse effect on stocks thus far during this meteoric rise from the March depths; maybe something has changed as we close in on year end – we shall see.

There was a pretty good flood into the short-end of the Treasury curve as the two-year note fell 4 basis points to yield 0.7%. The two-year yield hasn’t hit this level since we were in the middle of the storm in December 2008 – maybe fund managers have decided to begin booking equity-market gains and sit in Treasury securities to year end.

Still, the 1.34% decline in the broad market was hardly substantial considering the spike in prices over the past eight months; the rush into the Treasury market – the two-year yield has plunged 30 basis points since late October, the 10-year yield is down 20 bps over this four-week span – would normally put significant pressure on stocks, yet they are barely off recent highs. It’s a strange market environment for sure. The broad market was actually down 2% at the day’s nadir, but rallied in the final 90 minutes to erase a good deal of those losses.

Energy shares led the decline (down 2.07%) with financials and information technology not far behind. Traditional areas of safety, consumer staples and health-care, were the relative winners on the session – down 0.33% and 0.53%, respectively.

Market Activity for November 19, 2009
Initial Jobless Claims


The Labor Department reported that initial jobless claims held steady last week at 505,000 (in line with the expectations of 504K) from the upwardly revised reading of the prior week -- originally estimated at 502K, but revised up slightly to 505K. The four-week average of initial claims fell 6,500 to 514,000.

We’re still waiting for that move below the 500K level.

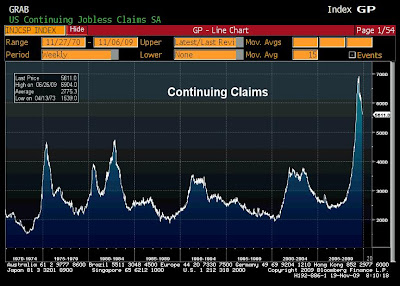
Continuing claims fell for a ninth-straight week, down 39,000 to 5.611 million in the week ended November 7 (there’s a one week lag between initial and continuing claims). However, as we’ve been talking about, jobless benefit extensions rose, more than offsetting the decline in standard continuing claims. As the unemployed see their traditional 26 weeks of benefits run out they are moved to Emergency Unemployment Compensation (EUC) and its several extensions. EUC rose 101,838 for the week and extended benefits (the various tiers to EUC) rose 17,170.

Extended benefits now run up to 99 weeks, as we discussed earlier in the week. This extremely wide social safety net (maybe more appropriate to term it a hammock) will, at the margin, keep the jobless rate high.

I’ve put this exhaustion rate chart up several times now. It is a monthly number so it hasn’t changed since last week, but I find it helpful to paint the picture. This is the exhaustion rate of standard (26 weeks) unemployment benefits. It continues to make new highs not only because the labor market is a wreck, but also because Congress continues to add extensions.


Philly Fed

The Philadelphia Federal Reserve Bank’s survey of manufacturing activity accelerated to 16.7 in November from 11.5 in the previous month – the estimate was for a move to 12.2. This is a big reading for Philly and is a bit contrary to that of Empire Manufacturing, which showed New York-area factory activity decelerated – these are the first looks at factory activity for November.

A couple of the sub-indices showed substantial improvement. New orders jumped to 14.8 from 6.2, great sign for next month’s activity; shipments soared to 15.7 from 3.3 – although this is a just a follow through of the prior month’s higher reading. The number of employees remained in contraction mode, but rose to -0.5 from -6.8; the average workweek moved to expansion for the first time since December 2007 – that’s when the NBER (official arbiter of business cycle expansions and contractions) stated the recession began.

However, while employees and average workweek improvements show the pace of firings declined, a couple of indicators on actual hirings moved deeper into contraction. Unfilled orders fell to -5.4 from -1.3. The delivery times readings fell to -12.7 from -9.3. These readings indicate that factories are not burdened with a degree of orders that current payroll counts cannot fill or deliver. It does not speak well for new hires because it shows they’re not needed.

Just as we’re watching for a meaningful move below 500K on initial jobless claims, we will keep a close on these two factory readings (unfilled orders and delivery times) for evidence that meaningful additions to payrolls are on the horizon.

The inventories index rose to -17.3 from -31.8 – a substantial improvement but shows firms are still destocking. A full-blown inventory dynamic is not yet upon us but GDP only needs for stockpiles to decline at a slower rate to boost the reading. The fact that this inventory reading is barely better than the average since the recession officially began (-17.3 vs. -20.4 average) illustrates that business confidence remains lackluster.

Mortgage Delinquencies

The chart above speaks for itself, but it does exclude the inventory of foreclosures. The number of mortgages either delinquent or in foreclosure is 14.11%.

Here is the delinquency breakdown:

Among fixed rate mortgages, the delinquency rates are as follows: 5.67% of prime loans; 24.57% of subprime; 13.90% of FHA

Among adjustable rate mortgages, the delinquency rates are as follows: 12.37% of prime loans; 28.23% of subprime; 14.36% of FHA

What we have seen over the past few months is that prime loans are beginning to drive foreclosures; at the beginning of this housing contraction, it was sub-prime leading foreclosure rates higher. This tells us it is not just about bad loans written and a lack of credit standards, but the highest jobless rate in 26 years is doing the damage.

This data screams of a significant increase in home supply. The number of loans 90 days late or in foreclosure is now over 4 million, according to the Mortgage Bankers Association. To put this number into perspective, there is currently 3.8 million new and previously occupied homes for sale.

Based on such a larger number of homes waiting to hit the market I fail to see how housing escapes another round of price decline, and the resultant increase in bank losses. Economists who expect a robust economic expansion to ensue appear to be living a fantasy.


Have a great weekend!


Brent Vondera, Senior Analyst

Thursday, November 19, 2009

Daily Insight

U.S. stocks stumbled, but just slightly, as the latest mortgage applications index and October housing starts showed that a new round of home-buying weakness is likely upon us. Concerns are also increasing over FHA-backed mortgage loans. The latest to express concern about the FHA is Robert Toll, CEO of home builder Toll Brothers, who referred to the situation as “a definite train wreck.”

The FHA’s required down payment is only 3.5% and these loans now make up 24% of the market, up from 3% in 2006, if memory serves -- we’re looking at a lot more mortgages going underwater. With 14.4% of FHA-backed loans at least 30 days late and 7.8% at least 90 days late (according to the Mortgage Bankers Assoc.), this will work as another incremental force keeping foreclosure rates heightened and another taxpayer bailout is coming. Book it, it’s a done deal.

However, this market is living in a keep-up-the-bad-work mindset. The broad market rallied late in the session to darn-near erase earlier-session losses. What’s bad is good in this bizarro environment because it signals an increase in ZIRP’s lifecycle – easy money continues to boost the appetite for risk.

Financials led the rally as billionaire John Paulson, president of the eponymous hedge fund, put a price target of $29.81 on Bank of America by 2011 – the stock currently trades at $16.35. Sounds like he either wants to juice his trade or believes the Fed will remain at or near zero for another two years.

Among the 10 major industry groups, health-care and telecoms were the only other sectors to close in positive territory. I found it interesting that basic material and energy stocks failed to close higher even as metals and energy prices gained ground. Also, the dollar nearly gave back all of its prior session gains, still these dollar-down trades couldn’t make it to the plus side.

Volume was weak again as barely more than one billion shares traded on the NYSE Composite – that’s roughly 18% below the six-month daily average.

Market Activity for November 18, 2009
Mortgage Applications

The Mortgage Bankers Association reported that its applications index fell 2.5% in the week ended November 13, even as the 30-year fixed-rate mortgage averaged 4.83% -- the lowest level since May.

The purchases index fell for a sixth-straight week as buyers were frozen, uncertain as to whether the tax credit would be extended or not. Now that that extension has been promulgated, it should unfreeze home sales in the coming weeks. Nevertheless, I wouldn’t expect quite the effect it had in the summer as we’re now past the traditional buying season and most of those who were able to take advantage of the credit probably have.

The purchases index is down to the lowest level since late 1997.

Refinancing activity slipped 1.4% after large bounces over the previous two weeks of 11.3% and 14.5%, respectively.


Consumer Price Index

The Labor Department reported the headline consumer price index (CPI) rose 0.3% in October (+0.2% was expected). The core rate, excludes food and energy, rose 0.2% (+0.1% was expected).

Year-over-year, headline CPI was down 0.2%, the slightest decline since y/o/y comparisons began posting negative readings in March. This will change to an increase when the November data is released. Even if CPI comes in unchanged for the month, the y/o/y figure will be up 1.5%. If the current monthly trend continues to December, the y/o/y figure will close in on 3%. The degree of increase in the headline y/o/y readings from there will depend upon the direction of the dollar and the rise in commodity prices.

The y/o/y reading on the core rate remained benign, 1.7% for October.

The main contributor to the October rise in headline CPI was the transportation segment (which consists of private and public vehicles and gasoline) – it accounted for 71% of the increase. The core rate was driven by new and used vehicle prices, accounting for 58% of CPI’s October increase when excluding food and energy.

Used vehicle prices, at least according to CPI, rose 3.4% last month and this component is up 31% at an annual rate over the last three months -- clearly a function of clunker cash. Thanks Congress!

Housing Starts

The Commerce Department reported that housing starts plunged 10.6% in October – which is pretty amazing considering starts remain on the mat, but this is necessary due to weak fundamentals. Builders broke ground on 529,000 units at an annual rate, the market was expecting a rise to 600,000 units. Overall housing starts are down 30.7% from the year ago period and 76% from the cycle peak hit in January 2006. (On the chart below, SAAR stands for seasonally adjusted at an annual rate.)

Construction starts on single family units fell 6.8% in October. The 476,000 in single family starts (at an annual rate) is 33% above the all-time low hit in February but even with this bounce the number remains 9% below the erstwhile record low, which was hit in 1981.

Multi-family starts slid 34.6% in October, which follows a 19% decline in September. The 53,000 in multi-family construction starts marks a new all-time low.

Housing construction permits, obviously an indication of future work, fell 4.0% last month -- down 24.3% from the year-ago period. It appears that boost third-quarter GDP receive from residential construction (the first in 15 months – sorry I think I stated 13 months in a letter earlier this week) was a one-and done event.

Bumpy Road – Not Just a Metaphor

We are in the process of $787 billion in deficit spending that is specifically slated as stimulus – traditional infrastructure projects, entitlements, health services, energy efficiency, etc. Something in the range of $45-$65 billion is earmarked to highway and transportation projects. So why exactly do I find myself dodging I-270 potholes on the way to and from work?

Recall our skepticism early this year regarding the claim that there are “shovel ready” projects. That is, the claim that money will be delivered directly to state and local governments which have projects ready and waiting, and thus immediately result in new work – a wonderfully conspicuous event for politicians as Americans would be able to see this activity as they go about their daily lives. Well, only the naïve believed this claim as there is an arduous, and well-known, appropriations process that stands in the way of immediate results. Still, one would think we’d get something to show for this, one of many budget busting, programs. Apparently, they can’t even resurface roads in a reasonable timeframe.


Have a great day!


Brent Vondera, Senior Analyst

Wednesday, November 18, 2009

Daily Insight

U.S. stocks refused to stay down yesterday, extending the latest winning streak to three days. After spending nearly the entire session below the flat line, the major indices rallied in the afternoon to eventually close the session slightly higher. The S&P 500 is within 1% of recouping half of its losses from the October 2007 record high of 1565 – 1120 on the S&P 500 marks that point from the closing low of 676 on March 9, 2009.

The market completely shook off a lackluster industrial production report and comments from Fed Chairman Bernanke the day before on the state of the economy, statements that had pre-market trading tracking lower. A rally in commodity-related basic material shares (up about 1%) led the broad market into positive territory.

Consumer discretionary shares were the biggest loser on the session (down 0.74%). Of the 10 major industry groups, six rose and four fell.

Volume was very weak as less than one billion shares traded on the NYSE Composite.

Market Activity for November 17, 2009
Producer Price Index (PPI)


The Labor Department reported that producer prices rose 0.3% in October (+0.5% was expected), after a 0.6% decline in September. Year-over-year the reading is down 1.9%. Excluding food and energy, what’s known as the core rate, PPI fell 0.6% for the month and is up just 0.7% year-over-year. So on the more headline numbers the data remains uneventful.

A look within the report gets a little more interesting. Over the past three months, PPI is up 7.4% at an annual rate. That’s up from +0.6% by the same meaure in September.

Total intermediate goods (those used in the middle stage of production) were up 0.3% in October and are higher by 9.7% annualized over the past three months (although mostly due to a large increase in August, which had clunker-cash auto assemblies written all over it). Core intermediate goods fell 0.5% in October, but are up 5.5% over the past three months at an annual rate. Crude materials (those used at the initial stage of production) were up 5.4% in October; the core rate was up just 0.5% after huge back to back gains in September and August of 3.6% and 6.0%, respectively. On a three month basis, total crude goods are up 31.5% and the core rate for crude goods is up 48.6% at an annual rate – albeit from pretty low levels.

So, there is evidence of underlying inflationary pressure. We’ll see how this materializes into higher headline PPI readings and later consumer price inflation. For sure much of these underlying pressures will be absorbed as the slashing of payrolls has worker productivity at elevated levels; nevertheless, we’ll certainly see PPI begin to post positive year-over-year numbers when the November reading is released. By December, it is likely y/o/y PPI will begin to run at 3.5%-4.0%. Not terribly concerning, but it is a significant turn from the trend of negative readings of the past year.

We’ll continue to watch credit. When it begins to expand again, that is when the unprecedented level of dollars the Fed has pumped into the system will result in much higher inflation readings.

Industrial Production and Capacity Utilization

The Federal Reserve released their monthly industrial production figure, which showed if not for the third-coldest October on record production would have ended a three-month streak – a bounce off of the most prolonged contraction in the post-WWII era.

Industrial production (IP) rose 0.1% last month (+0.4% was expected) after rising at a downwardly revised 0.6% in September – previously estimated to have risen 0.7%. There are three main components to this data: manufacturing, utility and mining production.

Manufacturing fell 0.1%, held back by a 1.7% decline in auto production after huge increases over the previous three months. There we had clunker-cash driven auto sales (and thus assemblies) driving the previous IP gains and now that that has run its course, we’re seeing the short-term effects of that program in this weak reading. Machinery orders did rise, up 0.2% for the month. Computer and electronics production fell 0.3%. Overall business-equipment production fell for an eighth month in 10 and is down 6.7% year-over-year – down 10.79% at an annual rate since peaking in March 2008. Production of construction supplied fell hard for a second-straight month, down 1.2% in October and down 17.0% over the past year.

Mining production fell 0.2%, a bit of a surprise at these commodity prices.

Utility production saved the month as the segment posted a 1.6% gain.

Capacity utilization (CU) inched up for the fourth-straight month, touching 70.7% -- the cycle low, also the all-time low (data goes back to 1967), of 68.3% was hit in June. The long-term average on this reading is 81.0%, so we’ve got a ways to go before a meaningful degree of hiring begins. Firms will increase current employees’ hours worked before adding to payrolls, as we’ve been talking about for some time now.

Manufacturing industry CU ran at 67.6% in October – the long-term average is 79.7%. Utility CU ran at 79.0% -- the long-term average is 87.6%. Mining CU ran at 83.5% -- the long-term average is 87.5%. It won’t take long for mining utilization to blow through the average if the dollar stays down and commodity prices high.

National Association of Home Builders (NAHB) Index

The NAHB showed confidence among homebuilders remained at depressed levels in November, unchanged from October at 17 – a reading below 50 illustrates most home builders view conditions as poor. High joblessness, lofty foreclosure rates (filings surpassed 300,000 for the eighth-straight month in October, according to RealtyTrac) and problems obtaining credit are all holding down sentiment.

The NAHB also gauges buyer traffic and sales expectations for the next six months. The buyer traffic gauge was unchanged at 13 – the recent high is 17 and the all-time high is 60. The gauge of future sales rose two points to 28 – the recent high is 30 and the all-time high is 83.

For Some Reason I’m not Feeling Stimulated

Bloomberg News reported yesterday afternoon that the House is working on a “job creation” plan this year that will include money for highway construction (sorry, that creates work not jobs), tax credits for small businesses to hire more workers (one assumes this is the vaunted concept that first made the rounds this past summer – a $4,000 tax credit to be paid over two years; if members of Congress took the time to inform themselves of what it costs to hire a worker they’d understand how silly this $ amount is), and finally, drum roll please…another extension of jobless benefits (that would bring us to triple digits as current extensions run out at 99 weeks).

Bienvenue a l’aupair etat.


Have a great day!


Brent Vondera, Senior Analyst

Tuesday, November 17, 2009

Daily Insight

U.S. stocks shook off an ugly consumer confidence reading to close higher on Friday. The gain pushed the broad S&P 500 up by 2.26%, which follows a 3.20% move in the week prior – completely erasing the pullback of late October. The Dow Industrial Average added 2.46% for the week and the NASDAQ Composite rose 2.62%.

Consumer discretionary shares led Friday’s gains, which was pretty strange considering the latest consumer confidence reading – we’ll touch on those results below. It appears the consumer discretionary trade got a boost from Disney’s earnings that beat expectations on Thursday night. But the results were able to beat only because of massive cost cutting and a jump in fees from cable operators. The television division drove the number. Advertising and them parks continue to struggle, which is to be expected.

Technology shares also performed well, as did traditional areas of safety such as utility and consumer staples.

Small cap stocks also rose for the week, but have underperformed the large caps over the past four weeks, which may be a sign this rally is getting tired.

There’s certainly no indication the equity sprint is running out of steam this morning though as stock-index futures are up big. A pledge from Asian countries to maintain stimulus measures – pretty much a redux of the statements we got out of the G-20 a week ago – has provided more juice for the risk trade. Commodities continue to roll as gold has hit $1130/oz., oil’s closing in on $80/barrel again (even though fuel demand is weak) and copper hit a new 14-month high -- and is not all that far from the super-spike level of 2008.

The dollar, of course, is getting hammered back to the 74 handle on the Dollar Index as the Chinese government said they will not re-value the yuan (which we talked about last week) and is having a field day ripping on Fed policy over the past several years.

Forget the problems that ZIRP causes in an economically endogenous sense – higher commodity prices, the improper assessment of risk as investors scramble for yield, dropkicking the dollar and exacerbating the credit contraction as banks simply borrow at nothing and invest in Treasury securities instead of making loans. This Fed policy has enormous potential in creating international tensions, problems to which we won’t know the extent until they occur.

Instead of acknowledging this issue, along with the massive deficit spending and protectionist policies that are also damaging relationships, our policymakers are in Asia talking about climate change. You want to talk about misplaced priorities, this is a striking example. When we get to the end game, when the markets no longer rise simply because countries say they are going to keep their stimulus measures floored and the consequences of all of this short-minded stimulus must be paid, I’m betting we’re not going to find anyone who takes life seriously concerned about climate change (it’s interesting how the climate Malthusians no longer call it global warming).

Market Activity for November 13, 2009
Trade Balance

The Commerce Department reported that the September trade balance registered a deficit of $36.472 billion for the month, a widening from the -$30.849 billion difference in August. The real (inflation-adjusted) deficit widened to $41.71 billion, or 10.1%, from 37.86 billion.

There are a couple of quick takes from this: One, the punishment the dollar has endured isn’t helping to narrow the deficit – which is what all the academics tell us must happen; some people are not surprised they’re wrong. Two, since this is the trade data for the last month of the third quarter, it means a lower revision to the GDP reading – a widening of the trade figure subtracts from GDP.

A significant reason for the wider difference between exports and imports is the higher price of oil, this is one reason the “lower dollar is good for narrowing the trade balance” conventional wisdom is flawed – a lower dollar means an increase in the price of oil.

Indeed, the imported crude-oil number jumped to $4.06 billion for the month, or a 26.2% increase. (The trade deficit hit its historically wide levels back in 2006-mid/2008. Those wides in the trade figures were driven by Greenspan/Bernanke & Co. keeping rate too low for too long, which encouraged the credit expansion and thus the big import flows. Of course, the seven-fold increase in the price of oil (from $20 in 2002 to $140 by the summer of 2008) had something to do with this too. The dollar, which plunged 40% in value against a basket of other currencies during this period, drove that oil price. Again, so much the conventional wisdom – according to their beliefs the U.S should be running a huge trade surplus as a result of such dollar decline.

But back to this latest data, exports rose a healthy 2.9% for the month, but imports rose more, up 5.8%. Ex-petro, imports still rose 4.4% and this was fueled by the clunker-cash scheme (and you thought you had heard the last of that term) as auto parts and supplies imports jumped 11.5% -- automotive goods accounted for 18% of all imports in September.

The exports reading was boosted by a 45.7% increase for commercial aircraft after a 40% decline in the previous month – this volatility is not unusual. Exports of industrial machines and telecom equipment were also good.

Import Prices

Import prices rose 0.7% in October, up for three-straight months and seven of the past eight. No one seems to be paying much attention to this data, probably because the year-over-year reading is down 5.7% -- the 12th month of decline. But over the past six months, import prices are up 13.3% at an annual rate. The actual year-over-year reading is going to post a dramatic shift by the time of the December figures -- even if the number is flat over the next two months that reading will shift from -5.7% as of this data to +7.0% by the December reading.

University of Michigan Confidence

The U of M.’s headline consumer confidence reading for November fell back to 66.0 from 70.6, which brings the index back to where it stood in July. The Economic Conditions reading slipped to 69.6 from 73.7 (which was the highest level since April 2008). The Economic Outlook reading fell to 63.7 from 68.6.

This survey does not involve a specific question on consumers’ take of the job market environment, such as the more widely watched Conference Board’s confidence reading does. Thus, one may expect another decline in that survey, which is already at a level that matches the worst readings of prior recessions, going back to 1967.

The Week Ahead

This week will be a big one on the data front as we get retail sales (October), Empire and Philly Manufacturing (November), Industrial Production (October) and Housing Starts (October).

Today we’ll kick it off with one of the most watched numbers, retail sales for October. The reading should post fairly strong results, a number that has a good shot of beating the 0.9% increase that’s expected (+0.4% ex-autos and +0.2% ex-auto and gas).

This market is likely to get excited if the reading is as good as I think it will be as there’s a lot of wishful thinking rolling out there with regard to intermediate-term consumer activity trends. But the weather will have provided a fake out. Last month was the third-coldest October on record and that means it pushed forward fall and winter apparel sales. We’ll see how it turns out in about 30 minutes.


Have a great day!


Brent Vondera, Senior Analyst

Daily Insight

U.S. stocks remained in rally mode on Monday after a good retail sales report and Asian countries’ pledge to maintain stimulus spending. As a result, energy and basic material (commodity-related shares) led the advance.

The largest daily gains over the past couple of weeks have followed policymakers’ statements that aggressive monetary and spending policies will continue. For instance, the broad market jumped 1.92% the day following the latest Fed meeting in which the FOMC stated conditions warrant “exceptionally low levels of the federal funds rate for an extended period.” Then the S&P 500 rallied 2.22% a week ago Monday after the G-20 members agreed to continue stimulus spending. Now we have this 1.45% move yesterday, which immediately followed the pledge from APEC (Asia Pacific Economic Cooperation). The impetus for these rallies appears to be pretty obvious.

To be sure, the retail sales data had something to do with the rally. Or rather what it didn’t do, it didn’t damage the higher sentiment that was evident by pre-market futures trading. A number of segments within that report showed decent-to-solid growth, but the ex-autos number did miss expectations and the downward revision to the previous month was substantial. The overall reading easily surpassed expectations, but only because auto sales bounced from a very weak September reading -- the autos sales chart below tells it all.

Advancers trounced decliners by an eight-to-one margin on the NYSE Composite. Volume was unimpressive as less than 1.1 billion shares changed hands.

Market Activity for November 16, 2009
Bernanke’s Dollar

Whoa! The Fed chairman not only mentioned but spent considerable time talking about the dollar, and the corresponding increase in commodity prices, in yesterday’s speech to the Economic Club of New York. Of course, he had to point out that he believes inflation will remain subdued for some time (and he may be right so long as credit continues to contract, but the moment it picks up so will the velocity of money and all of those dollars pumped into the system will cause prices to rise, and fast).

The Dollar Index spiked on the news, but quickly plunged back to where it was trading before the comments. The markets will require action, talk is not nearly sufficient to reverse the dollar down trade – but if this is a first step we’ll take it. Is this an early signal the Fed is thinking about a little ratcheting? Let’s think about that.

If mildly increasing fed funds shows the world that the Fed is somewhat serious about keeping the dollar from drowning in a sea of aggressive monetary easing, it will make their eventually unwinding of current policy much easier. Conversely, if they keep ZIRP in place and the dollar heads lower, commodity prices keep flying and traders continue to push stocks to valuations that do not appear to be commensurate with realities on the ground, then the Fed’s job in the months ahead will become all the more politically unsavory. The longer they wait, the more aggressive the tightening campaign will be and this will be very harsh on asset prices. I know I’m reaching here. It’s highly unlikely the Fed will move on rates before the unemployment rate peaks (and we’re at least six months from this occurring). But allow me to dream for a moment.

The market surely didn’t view his statements as anything but lip service as stocks kept chugging along and the Dollar Index moved down to the 74 handle and then to intraday lows. The dollar bounced off of that low mark but finished below the day’s average price – as you can see above.

Retail Sales

The Commerce Department reported that retail sales jumped 1.4% in October (+0.9% was expected) after a big downward revision to the previous month – down 2.3% vs. the -1.5% initially estimated.

The overall gain in retail sales for October was mostly due to a bounce in auto sales after a very weak September. (Of the $4.7 billion increase in sales, autos accounted for $4.0 billion.) But we did get good results from the apparel and general merchandise segments – there’s that colder weather event we talked about; last month marked the third-coldest October on record.

Excluding autos, retail sales rose 0.2% (following a downwardly revised 0.4% increase for September. The ex-auto reading was weighed down by a large 2.4% decline in building materials. Take out autos, building materials and gasoline (what’s known as core retail sales and the number that feeds directly into the personal consumption reading for GDP) and retail sales were up 0.5% for the month – that gets the fourth quarter off to a good start.

Quickly on that building materials decline, this is a pretty bad sign for residential home construction. Home building added to GDP last quarter for the first time in 13 quarters. The increase in this area will probably prove fleeting.

Autos (motor vehicles and parts) jumped 7.4% in October. Gas station receipts were flat after rising for two months in a row. The segment is down 15% year-over-year.

Clothing and general merchandise looked good as sales for those segments rose 0.4% and 0.8%, respectively. Eating, drinking (the segment that I often refer to as unfazed by high joblessness as a significant portion of this reading involves 20-somethings) jumped 1.2%.

Furniture, electronics, sporting goods, and again that building materials reading, were all down.

From a year-over-year perspective, overall retail sales are down 1.7% from the very weak October 2008.

Empire Manufacturing

New York-area manufacturing activity grew in November but at a reduced rate relative to October. The Empire Manufacturing index came in at 23.51 for the month (6.5 points below the expectation) after a 34.57 in October. A reading above zero marks expansion, so this is a good number even if it missed the forecast. (This differs from the ISM and Chicago manufacturing surveys in which a reading of 50 is dividing line between expansion and contraction.) That big reading for October (the best since 2004) seemed to be artificially boosted by auto assemblies following clunker cash.

In terms of the sub-indices, new orders fell to 16.66 from 30.82 in October. Delivery times fell to -2.63 from 3.90 in October – this shows firms are having no problems delivering orders even with the slashing of payrolls, not a particularly good sign for job gains. Employment fell to 1.32 from 10.39. However, these are the first back-to-back positive readings since the spring of 2008.

The two readings getting most attention right now – inventories and average workweek – were not helpful.

Inventories ticked up to -17.11 from -18.18, but remain well in contraction mode. We have yet to receive evidence that firms feel comfortable enough to boost stockpiles – and that means production remains lackluster.

The average workweek reading fell back to 5.26 after bouncing to 20.78 in October. We were waiting to see some extension to that previous reading, for sure current employees will have to see their hours worked increase dramatically before factories bring back those who have been laid off. It is good to see this reading in positive territory, but after the aggressive manner by which manufacturers have slashed payrolls, this measure needs to post a series of outsized gains in order to deliver an addition to factory employment anytime soon.


Business Inventories

The Commerce Department reported that business inventories fell 0.4% in September, the slowest rate in a year, showing what the latest GDP reading also illustrated – inventory slashing has ended. To be sure, stockpiles continue to be cut, firms have neither the confidence nor the demand to begin to rebuild, but this is an important first step. Auto inventories jumped in September, due to very weak sales for the month. Excluding auto, business inventories fell 0.6%.
The sales data attached to this report showed a decline of 0.3% after three-straight months of increase. The inventory-to-sales ratio held at 1.32 months worth of supply. This reading probably needs to fall back to 1.25 (near the record low) in order to get firms building stockpiles again in this environment.

Economists are watching for a build in ex-autos stockpiles as evidence the inventory dynamic has arrived – this is what will catalyze GDP for a couple of quarters. I’m guessing the first and second quarters of 2010. Many readers may notice I keep pushing this estimate forward. A couple of months back I had estimated the inventory dynamic would be in full swing by the fourth quarter. We’re still waiting for its arrival.


Have a great day!


Brent Vondera, Senior Analyst

Monday, November 16, 2009

Fixed Income Weekly

The process of money creation is complex. Flooding the market with cash to keep Fed Funds low is a very traditional way to stimulate an economy, and the Fed is all in on that front with Fed Funds at zero. They took it a step further this year and moved into longer assets to bring down longer term interest rates on things like mortgages. All of this buying has left banks flush with cash and rates low, hoping to spur lending and economic growth. Fed funds has been at 0-.25% for 11 months, they have purchased $300 billion in Treasuries notes, over $1 trillion in Agency MBS and over $100 billion in Agency debt in addition to $43 billion in TALF and billions more in other confusingly named programs. So why isn’t there any real growth?

The graphs below show the decline in credit since late 2008. The first graph shows Commercial Loans, the second shows Consumer Loans.

Banks are required to hold a certain amount of cash at the Fed, called required reserves. Excess reserves, cash that banks chooses to hold at the Fed in excess of the required amount, have grown since the Fed began pumping the system with cash. The reason for this is lack of demand for funds by both households and businesses – basically banks have nothing to do with all the liquidity. The graph below shows the level of reserves, both required and excess, that banks currently hold at the Fed.

True money creation is more than just Fed induced liquidity. Money creation will only happen if there is adequate demand for money, and right now there isn’t. Excess liquidity has a track record of producing high levels of inflation, but the lack of demand for loans is keeping inflation in check right now.

The public can ridicule banks all they want for not lending, but that is not the problem. Businesses are not expanding and households are still trying to repair the damage done to their home values and/or from their lost income. Stimulus, whether it is monetary or fiscal, still relies on true demand to foster a recovery, and risky asset rally that has been labeled an “economic recovery” has some difficult times ahead unless we get some.

Cliff J. Reynolds Jr., Investment Analyst

Friday, November 13, 2009

Daily Insight

U.S. stocks gave back early-session gains as energy and financial shares put pressure on the broad market. The day’s major economic release, the weekly jobless claims data, actually offered the best result on the direction of claims we’ve seen in a while; however, a negative energy report reminded the market of the economic weakness and lack of demand that remains – more on that below.

Traders sort of put the screws to energy stocks after that report, and financials took a little heat too as RealtyTrac stated U.S. foreclosures surpassed 300,000 for the eighth month in a row. The bigger issue is the inventory that has yet to hit the market as banks are delaying the foreclosure process.

All 10 major S&P 500 sectors declined on the session, although the broad market jumped 6% over the past couple of weeks so a day of weakness is hardly consequential. The S&P 500 has bumped against the 1100 mark twice now, yesterday and on October 19, only to retreat. This is probably going to be an important level for technicians over the very short term.

Eight stocks fell for every one that rose on the NYSE. Some one billion shares traded on the exchange – that’s three days in a row now; the six-month average is 1.25 billion.

The $16 billion 30-year Treasury auction didn’t go quite as well as the 3 and 10-yrs earlier in the week, but those were very successful auctions – this one was still pretty good considering the duration. The yield was a bit higher than the pre-auction expectation (4.469% vs. 4.424%) and the bid to cover was 2.26, down from the 2009 average of 2.43. Indirect bidders (foreigners) totaled 44%, which is in line with the 2009 average.

These long bond sales are definitely trickier events as 4.46% for 30 years only looks good in this low inflation, weak economic environment we find ourselves. But with Fed at zero, the dollar’s trend lower and the largest budget deficits since WWII (all factors that have great potential to crush the long bond), the government is surely very happy people are out there buying this stuff at these levels.

Market Activity for November 12, 2009

Crude Oil

The weekly Energy Department report showed crude supplies rose 1.76 million barrels last week to 337.7 million (5% above the 5-yr avg. for those keeping track) – a one million barrel build was expected.

Gasoline stockpiles rose 2.56 million even a refinery runs are at the lowest level since Hurricanes Gustav and Ike hit the Gulf coast n September 2008. Refineries operated at 79.9% of capacity (the average rate is closer to 88%). Demand is ugly, fuel consumption tumbled 4.3% to 18.3 million/day last week (12% below average).

This report is not a good sign for those expecting average economic growth to emerge.

Mortgage Applications

The Mortgage Bankers Association’s index of applications rose 3.2%, fueled by an 11.3% jump in refinancing activity for the week ended November 6 – this follows a 14.5% surge in the prior week as the 30-year fixed mortgage rate held below 5.00% for these two weeks. We’ll note, the refinancing index running at only a third of 40% of where it was back in April and is just 30% of the spike during the refi wave of 2003 – the vast majority of those who can refinance their mortgage likely already have.

The purchases index fell 11.7%, marking the fifth-straight week of decline – the purchases index fell to the lowest level since December 2000 (and that is only because of an anomalous one month slide in 2000, one really has to go back to 1998 to match this level of purchases. Apparently, a sub-5.00% 30-year mortgage rate isn’t enough to unfreeze buyers as they saw the tax credit expiring. That credit has been extended now and we will see if it has the same effect on sales as it had over the previous few months. It all depends on the degree to which the original timeline of the credit front-loaded home buying. Of course, home sales also have to contend with troubled labor market conditions. Those thinking housing is out of the woods need to think again.


Jobless Claims

The Labor Department reported that initial jobless claims made additional progress last week, falling 12,000 to 502,000 – this is the lowest level since hitting 488K in early January.

While 500K is an elevated level, the trend of the past two weeks is a very good sign as we’ve been looking for sub-500K as real evidence that labor market losses have bottomed. That does not mean the jobless rate will fall. To the contrary, it will rise for sometime and the upward move may still have some spike to it (remember the latest monthly jobs report saw the unemployment rate rise significantly even though the labor force participation rate fell. We still need to see that participation rate rise, as more workers come back in to look for work and that means meaningful increases in the unemployment rate ahead. But for the monthly job losses reading, as we talked about last week, those numbers will move to statistically insignificant levels of < 100K per month over the next couple of months and then to mild gains.
The four-week average of initial claims fell 4,500 to 519,750.
Continuing claims fell for an eighth-straight week, down 139,000 to 5.631 million, although more because of traditional benefits running out than job creation, as the exhaustion rate chart illustrates below.
Extended benefits also show there is some expiry going on as the EUC (Emergency Unemployment Compensation) program showed claims rise (more recent laid off workers moving from traditional to EUC), while extended benefits fell (the longer-term unemployed exhausting the extensions).
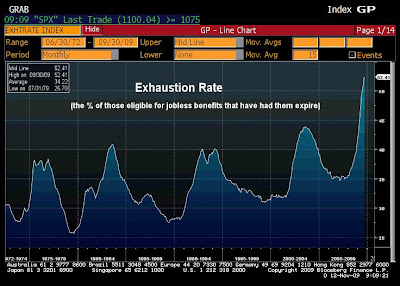
For a run down of how this works: Workers can apply for EUC when the standard 26 weeks of claims run out. EUC has four tiers (the second to fourth tiers are known as extended benefits: Tier 1 pays an additional 20 weeks, Tier 2 pays another 13 weeks, Tier 3 offers another 13 weeks and Tier 4 adds yet another six weeks – all automatically enroll those who are eligible when they run out of the previous tier. You can kind of see now how many unemployed workers are unlikely to have quite the sense of urgency to look for work, which is a reason there’s such a gap, a record gap, between U3 and U6 unemployment rates (U3 being the official jobless rate of 10.2% and U6 being U3. plus those that didn’t look for work during the month, plus those working part time for economic reasons).
A Tier 5 was added when Congress passed another extension measure last week, but since the emergency and extended claims data is only available through October 24, it shows a decline in extended claims. This figure will pick back up thanks to another extension when we get the next couple of weeks of data.
All in all, the claims data suggest that the pace of firings continues to decline, yet a pick up in hiring has yet to become evident.


But it’s Friday, so have a great weekend!


Brent Vondera, Senior Analyst

Thursday, November 12, 2009

Daily Insight

U.S. stocks gained ground as the S&P 500 moved to a new 13-month high. The broad market pared early-session gains on a quiet Veterans Day of trading (the bond market was closed, they’ve get more days off than a government job) but held to enough of that rally to now have completely erases the late-October pullback.

Financial led the way yet again, but basic material stocks weren’t far behind as the Bank of England signaled they will keep rates at emergency levels and left the door open to more government bond purchases. As this follows the Fed’s pledge to keep standing on the accelerator, the trade into commodity-related material stocks rolls on. Energy shares weren’t able to participate in the rally, ending the session essentially flat as the latest data out of Mastercard showed gasoline demand fell 2.3% in the latest week and is up just 2% from the very weak levels of a year ago.

Advancers beat decliners by a two-to-one margin on the NYSE Composite. Volume was weak as barely one million shares traded on the exchange, although I was expecting even less considering the holiday.

Futures are pointing lower this morning even with the news that Hewlett-Packard will purchase networking gear maker 3Com. Such deals usually get investor optimism going, maybe the market sees it as a bad deal. HP clearly wants to take on Cisco, they may be stretching themselves on this one.

Also, Wal-Mart just released quite good quarterly results, maybe too good as it shows discounters will reign supreme this holiday season, reminding this fairly euphoric market that the consumer is in rough shape – as if anyone needs reminding.

Market Activity for November 11, 2009
Holiday Sales, and More Importantly Spending Trends Beyond

And speaking of holiday shopping, we received some welcome news out of FedEx yesterday as the second-largest U.S. package-delivery company projects handling about 8% more shipments on their busiest day of the Christmas season. The company expects to handle 13 million packages on December 14, up from 12 million on December 15, 2008. The forecast is based on “positive signs” via the latest GDP and industrial production reports. For sure, what were likely good spending numbers during October probably also stoked their forecast. We’ll get the October spending numbers on November 25.

This is all fine and dandy, certainly expectations we would celebrate under normal circumstance, but the reality remains that households are dealing with a nasty combination – the highest level of joblessness in 26 years (and rising) and very high levels of indebtedness. We can get excited about higher holiday sales (and let’s hope this is true considering the year-ago period occurred smack-dab in the middle of credit-market chaos and a relative shutdown in spending), but basing expectations on the latest economic numbers that have been boosted by short-term stimulus programs may not prove to be the wisest thing to do. This is a theme we’ve talked about for some time now as the indicators that economists/analysts/businesses have historically looked to for evidence of what will occur in the near future may not work well this go around.

The stimulus is temporary, this form of stimulus must be as the levels of government spending, aggressive monetary accommodation and incentives to keep consumer debt levels high cannot last. Therefore, we’ll see more choppy activity instead of the typical development of things flowing and trending higher during the normal expansion. Indeed, consumers will have to work down debt levels and this will adversely affect spending, a situation that will prove more difficult and elongated if the jobless rate remains elevated for an extended period. This must occur in order to get back to normal and it’s why I remain quite skeptical about growth prospects – a skepticism that long time readers understand has not been my nature.

So let’s hope the holiday shopping season is stronger than that of the year-ago period. But don’t hope for too much because fundamentals do not support such behavior.

The China Trip

President Obama and his Treasury Secretary Tim Geithner are making a trip to Asia, actually Geithner has been there for a couple of days explaining to Japanese and Singaporean officials about how the administration will deal with massive budget deficits in the intermediate term – you know how to read these statements: higher across the board tax rates.

I believe President Obama arrives in Asia today and the main focus of the trip is to talk to Chinese President Hu Jintao about the “need” to strengthen the yuan (Chinese currency). I’m sure that’s going to go over really well as our own currency is devalued on weekly basis.

It was just Monday night in which the Chinese got in front of this trip by making the explicit statement that they’ll keep the yuan pegged to the U.S. dollar – meaning they are not going to allow it to rise. Then, suddenly, by Tuesday night they revised their statements to say they may gradually re-peg the yuan to a higher level against a basket of currencies. (This has its own implications. When the yuan is pegged to the U.S.dollar it means the Chinese must buy dollars to keep the pegged rate intact, which means they must buy Treasury securities. If they go to a basket that means their need to buy our government debt is reduced.) This revision to the statement comes after intense pressure from other countries in the region. The dollar has gained some support over the past two days as governments in Thailand, South Korea and Russia buy dollars (devaluing their own currencies) because the yuan is sliding in value against those currencies due to its peg to the dollar – as the dollar slides so does the yuan. It appears there is a race to the bottom as a destructive zero interest-rate policy by the Fed affects behavior across the globe. Widespread devaluation of currencies is not a good sign for future global growth.

But the administration goes to China with the overall belief that large amounts of Chinese exports funnel into the U.S. (well, at least before consumer activity took a turn for the worse), thus allowing higher levels of prosperity in China, only because their currency is fixed at what the administration judges as a low currency value. This is a flawed premise. The Chinese were not “dumping” goods into the U.S., as if to take advantage of the American consumer. The administration seems to be ignoring a vital piece of this puzzle – monetary policy.

Look, I’m not trying to play the Chinese apologist here, I frankly despise communist regime, and while they appear to have shifted to a softer communism that government can hardly be trusted. But darn, one cannot look at this as if we were preyed upon. Let’s concentrate on getting our own policies right and the rest will fall into place.

But the flood of imports from China in the previous few years was not nearly so much the result of the Chinese holding the yuan from rising as it was a function of our Federal Reserve’s stance back in 2002-2005, a topic we’ve spent much time on over the past several years. Chinese goods don’t arrive on our shores unless there is demand to support those shipments. (Besides, we should remember that the Chinese yuan has been pegged to the U.S. dollar since the mid-1990s – with the exception of an adjustment a couple of years back; this peg helped them escape the direct effects of the Asian Contagion in 1997-1998. I don’t remember anyone expressing a problem with this pegged rate until the Fed’s actions began to create market distortions. The people who should be, and probably are, complaining are the Europeans as the yuan has declined in value along with the U.S. dollar against the euro.) The goods really began to flood in when the Fed kept rates too low for too long earlier in the decade. This monetary policy fueled a consumer credit expansion that drove demand for these imports. So long as the Fed doesn’t royally screw up, the degree of trade deficit with China would not be nearly as wide. For that matter, the housing bubble would have never occurred. While literally everyone takes the blame for this mess, it’s starkly ironic to see the Fed largely escapes criticism.

When our government officials fail to understand, or simply ignore, the preponderant reason driving the topic with which their argument is based, it sort of makes their goal tough to achieve. We’ll find out who holds the whip hand during this visit to China. I don’t like the probable intermediate term answer to this question, based on the obscene level of deficit spending we’re engaged in.

Going Off

Emerson Electric’s CEO David Farr didn’t hold back in expressing his opinion of U.S. policy yesterday at an industrial conference in Chicago, saying: “Washington is doing everything in their manpower, capability, to destroy U.S. manufacturing – cap and trade, medical reform, labor rules.” He stated tax rates and regulations are pushing his company to create jobs in emerging market regions, “places where people want the products and where the governments welcome you to actually do something.” He didn’t stop there, going on to project his own question and answer: “What do you think I am going to do? I’m not going to hire anybody in the United States. I’m moving. They are doing everything possible to destroy jobs.” Wow!

This guy is going to take a lot of heat for these statements. I can see the coming accusations of anti-patriotism. But his attitude just shows he cares and wants to wake people up. He could be like the vast majority of multi-national corporate CEOs, who say nothing for fear of a backlash, but go ahead and move jobs overseas anyway due to higher domestic costs – and we should not only concentrate on the labor cost differential (which is simply the difference between rich and relatively poor societies), if we were to slash the corporate tax rate and implement a regime of streamlined and common sense regulations instead of insane mandates that do nothing but drive costs higher and destroy jobs we wouldn’t see so much outsourcing occur. (For the record, not all outsourcing is bad, some result in increased profitability and thus more higher-paying jobs here at home, but certainly more of it than would otherwise be beneficial occurs due to policy that drives capital away.)

So, Mr. Farr will certainly be labeled as anti-patriotic, but it is the business leaders that remain quiet, for fear of a backlash, who assist in damaging American exceptionalism.

Economic Data

We get back to economic data releases after essentially nothing over the past three days. This morning we await the weekly jobless claims data.


Have a great day!


Brent Vondera, Senior Analyst

Tuesday, November 10, 2009

Afternoon Review

S&P 500: -0.07 (-0.01%)

Today’s slight loss snapped an impressive streak of gains for the S&P 500 – the index had finished higher on every single trading day this month.

The U.S. dollar traded all over the place despite early gains that came on news that Fitch credit analysts said Britain is the most likely of the major economies to lose its AAA credit rating.

Several Fed officials delivered speeches today, which reiterated their view that the economy will recovery slowly and the unemployment rate will continue to rise in the near-term. There was also mention that financial reforms are needed to avoid a repeat of last year’s credit crisis.

In other news, the Fed’s latest survey of loan officers showed that credit conditions had tightened again, although less than in its previous survey. The results also revealed that banks are ramping up purchase of securities, notably Treasuries, instead of making loans. This is no surprise and has been happening for quite a while now. Banks borrow at practically nothing and earn a risk-free return on Treasuries. This trade is a lay-up for the banks and far easier than dealing with credit cards or business loans.

The Fed can create as much money supply as they want, but that doesn’t guarantee it will create credit. Without willing lenders and able borrowing, the cheap money will continue to flow into assets from equities to commodities to corporate debt.

Most market participants acknowledge recent gains have been fueled by cheap money, but there still is quite a bit of disagreement regarding the sustainability of the rally in coming months if the real economy remains sluggish.


--


Peter J. Lazaroff, Investment Analyst

Daily Insight

U.S. stocks rolled on wave of investor euphoria Monday, now almost completely recouping the losses of late October, as the nitrous oxide boost from global governments and central banks continues to stoke equity-market traders.

Stock-index futures showed strong investor sentiment in pre-market trading and that rushed into the official trading session. This weekend’s G-20 meeting dovetailed last week’s Fed meeting (you know, where Bernanke & Co. explicitly stated their zero interest rate policy (ZIRP) lives on) as all nations involved agreed to maintain measures of support to the global economy.

The market could have also been driven by the results of Saturday night’s health-care bill in which the House barely passed the measure 220-215. This was clearly a pyrrhic victory and it’s very likely the bill is DOA in the Senate, at least in its current form. I’m certainly not saying some wonderful common sense-based legislation is going to suddenly appear. But the most horribly harmful and foolish proposal is going down – unless they use the reconciliation process.

Financials were the top-performing sector, even as the Fed confirmed what many have been guessing -- banks are taking their basically zero-cost to borrow and using as much of these funds to buy Treasury securities as is going to loans. This should have put the screws to the banks stocks. (This is not to suggest that banks should be boosting loan originations. If they are concerned about problem loans on their books, then they shouldn’t be growing by making new loans. Too, the demand for loans is weak as well, particularly from the consumer side as households work down already heavy debt burdens. It’s kind of a dual issue for small businesses. Some need financing, but remain locked out of the credit markets. Others have no desire for additional credit, as the NFIB survey continues to show, as many see no reason to expand.) This is not the stuff that economic growth is made of. Borrowing at close to zero and investing in 1%-4% yielding Treasury securities may boost banks’ interest income in the short term, but the music stops when the Fed must eventually unwind policy, and that means Treasury yields shoot much higher as this source of government debt dries up. In addition, the lack of demand for credit also shows there is little confidence among business regarding future sales prospects.

Commodity-related basic material shares were the second-best performing group on the session as that G-20 meeting goosed the trade.

Advancers smoked decliners by an eight-to-one margin on the NYSE. Nearly 1.2 billion shares traded on the exchange, in line with the six-month daily average.

Market Activity for November 9, 2009
The Dollar


The U.S. dollar looks to make another dive for the 74 handle on the Dollar Index (and it did move to the 74 handle briefly before bouncing off the intraday low), a level that should begin to get policymaker’s attention. If the greenback cements that move it may be “Katy bar the door” time as the buck may slide back to the all-time low of 71.35 in quick order, this will surely get the Fed’s attention.

The greenback rallied in the final two weeks of October as there was some uncertain as to whether the Fed would change its statement regarding the latest meeting. Would they removed the word “exceptionally” (referring to the low levels of fed funds) and thus signal a removal of ZIRP – the emergency level of fed funds – in the near future. But when the Fed’s meeting concluded and the “exceptionally low level of the federal funds rate for an extended period” phrase remained intact, it was a clear sign the pedal to the metal stance will be with us for a while. This is damaging to the dollar and the gold trade shows it – breaking through $1110/oz. yesterday morning.

There doesn’t seem to be any policymakers (at least domestically) who currently see a falling dollar value as a problem. For sure, the conventional wisdom views this as a good thing in that it will boost U.S. export activity. If the dollar continues to decline, we’ll see yet again how flawed conventional wisdom can be.

It’s all up to the Fed from here, don’t wait for the Treasury Department to offer assistance because they are the conventional wisdom – so is the Fed for that matter, but I’m trying to give them the benefit of the doubt; although I’m not sure why. Just as the previous administration wrongly judged, this one also believes a lower dollar will benefit U.S. growth and jobs. They forget one very important reality. As capital leaves the U.S. (a falling, and unstable, currency value coupled with the very high probability that tax rates on investment are going higher does not promote capital inflows) it will create jobs in the places that that capital finds it will be best treated. My concern is the Fed will not focus on the dollar until it is already obvious we have a problem. If this occurs, the reversal of monetary policy will be quick, abrupt and very damaging.

This Week’s Data

We have a very quiet week on the data front, so the letters will be short as a result. There is not a major economic release until Thursday, which brings the usual jobless claims data.

What we’ll be watching for is a move below 500K on initial jobless claims, a level that has proven elusive since January. We saw claims fall to 488K in the first week of the year, only to deteriorate big time, jumping to 675K by February. For evidence that some net job creation is occurring, we’ll need for initial claims to at least make it back to the high 400K level.

On Friday we’ll get the trade balance (September), import prices (October) and the University of Michigan’s consumer confidence reading (November).

On trade, the market will be looking for evidence that the weak dollar condition is helping export activity.

On import prices, the data results will remain unconcerning, but this will change come the November data. This is when the year-ago comparisons become very easy and all of the inflation numbers begin to move higher.

On the confidence reading, despite the market’s focus on the easy-money trade, I think traders will still need to see a rebound from October’s drop. (It’s important to remember that the UofM confidence reading does not include a labor market component, as the more watched Conference Board’s confidence reading does. Thus, the UofM’s measure remains at a higher level, but still well below the long-term average.


Have a great day!


Brent Vondera, Senior Analyst

Monday, November 9, 2009

8 months since S&P 500 bottomed

The S&P 500 bottomed exactly eight months ago and has since rallied 64%. The U.S. economy was still contracting when the rally began, which is no surprise since financial markets tend to predict the direction of the economy anywhere from three to six months into the future.

As it turns out, third quarter GDP grew at a 3.5% annualized rate, vindicating the stock market’s rally. Whether the market has rallied too much is an entirely different discussion for another day. Today, I examined sector performance since the March 9 low. Take a look at the table below.

Clearly, economically-sensitive stocks have been outperforming strongly, something that one expects in bull, not bear, markets. “Cyclical” sectors outperformed in the eight months since the S&P 500’s bottom, with the financials sector jumping 140.6%, the consumer discretionary sector adding 81.5%, the materials sector growing 78.6% and the information technology sector gaining 77.7%. In contrast, “defensive” sectors like healthcare, utilities, and telecom underperformed.

The results in the table above should come as no surprise because these are often the sectors that benefit the most during this stage of an economic cycle. The diagram below from S&P Equity Research illustrates this very well.


Tomorrow I will explain why these sectors often perform the way they do in the different stages of the economic cycle.

--

Peter J. Lazaroff, Investment Analyst

Daily Insight

U.S. stocks rose Friday, not by much, but the numbers were green as the ZIRP trade rolls on.

Stocks had no reason to rise on Friday, let’s be serious. Take everything into consideration – record low hours worked data, which means meaningful employment gains will be hard to come by; a jump to 10.2% unemployment; a decline in labor force participation, which means the jobless rate will continue to spike in the months ahead; and Washington in complete freak out mode as they worry about the state of the labor market. This is the most worrisome event of them all as Congress is dead set on putting additional policies in place in their attempt to “fix” things in the short term, an agenda that will surely carry pernicious longer-term effects.

But that’s from the lens of labor-market fundamentals. As we’ve talked about for some time now, and a Sunday night WSJ piece appropriately touched on, what’s bad is good for stocks. Just maybe the jump in the jobless rate received a cheer from the market. ZIRP lives so long as the labor market is in shambles and stocks like that. However, it also means the last leg of this stock-market rally has zero to do with what’s going on in the economy, it is nothing more than the chasing game – lurching to capture any additional return that may remain. At some point though, the market must show it can grow on its own and the Fed must reverse course. The market will anticipate these events and that is when market psychology shifts on a dime, again. The longer ZIRP lives the more damaging its removal will be.

Industrials, consumer discretionary and health-care shares led Friday’s gains. Financials, utilities and energy were the losers on the session.

Volume was especially lackluster with just 1.034 billion shares traded on the NYSE Composite – about 20% below the six-month average.

The broad market recaptured 3.20% last week. This bounce nearly erases the losses of the previous two weeks – the S&P 500 is flat over the past seven weeks.

Market Activity for November 6, 2009
October Jobs Report

The Labor Department reported that payrolls declined 190,000 in October, a bit more than the -175,000 expected. The previous month’s data was revised substantially more positive though, showing a decline of just 219K vs. the -263K estimated last month. Revisions for both September and August showed 91,000 fewer jobs were lost than previously estimated.

Over the past six months jobs losses have averaged 272,000 per month, this is a huge improvement from the previous six months in which losses averaged a super-high 645K per month. The current level of job losses has finally moved to a range that is no longer at the deep levels of the prior three recessions and that is an important development – for the short term, and I’ll explain what I mean by this below.

In terms of specifics, the goods-producing industries shed 129,000 jobs last month, a deterioration from the 114,000 decline in September – just barely worse than the three-month average of -124K. The construction segment cut 62,000 positions, an improvement from the 68,000 reduction in September – a little better than the three-month average of –65K. Manufacturers shed 61,000 positions, significantly worse than the 45,000 loss in September – and worse than the three-month average of -54K.

The service-providing industries shed 61,000 positions, a huge improvement from September’s 105,000 decline – in line with the three-month average of -63K. The trade and transportation segment lost 66,000 jobs, exactly the same as September – the three-month average is -53K. Retail slashed 40,000, which was a bit better than the 44,000 cuts in September – three-month average is -35K. Business services posted its second straight month of increase, adding 18,000 payroll positions after September’s gain of 3,000 – three-month average is positive too at +5K per month.

The best sign in the report was the rise in temporary work, which is the best indicator that job losses will ease substantially in the coming months and we’ll print some mild job gains in the not-to-distant future. Temp services added 34,000 positions, after a 7,000 gain in September – that number was revised up as it showed a 2K decline via last month’s employment survey.

Government employment came in unchanged as a 19,000 increase in federal government jobs offset declines in state and local employment – state and local budget are in a world of hurt and will remain that way for a long time. In fact they are likely to even erode from here as federal government stimulus injections are making those budgets look better than they actually are.

The unemployment rate, which was the newspaper headline, jumped to 10.2% from 9.8% as we are in the process of testing that post-WWII era record of 10.8% hit in December 1982.

The labor force participation rate fell, which actually held back the rise in the jobless rate (you would normally see a large increase in participation for the unemployment to jump like this). This means when these workers feel good enough about things to look for work again the jobless rate will jump. One expects that the now 93 weeks of available jobless benefits (99 weeks for those in the 27 states with unemployment rates above 8.5%) is marginally decreasing the sense of urgency to look for work. Bienvenue a le au pair etat.

The U6 jobless rate – this figures includes the official jobless rate, plus those marginally detached (those too discouraged to look for work during this survey period), and those working part time because they can’t find full-time work, which probably reflects labor-market torpor more than anything else -- jumped to 17.5% in October from 17.0% the previous month. This measure was re-calculated in 1994, so we can only view it to that point.

In terms of its previous methodology the U6 jobless rate hit 14.0%, which is still below the postwar record of 14.3% hit in 1982.

The average duration of unemployment hit 26.9 weeks from 26.2 in September.
The duration of long-term unemployment (the percentage of the unemployed that have been out of work for over 27 weeks) held at the record high of 35.6%.


The average weekly hours worked data fell back to the record low (data goes back to 1964) of 33.0 from 33.1 in September – it’s dropped back to this record low three times now. Unfortunately, we’ll need to see this figure head to 34.0 before employers even think about adding jobs. The average over the past decade is 33.8 hours per week.

Ok, so we’ve endured 22 months of jobs losses now and they have been massive, unprecedented in the postwar era in many ways. Nearly 7.5 million payroll positions have been lost during this stretch and with the exception of the 602K decline in December 1974, even when adjusting for the expansion in the labor force, the monthly losses are without precedent – again, in the post-WWII era. The duration of this level of decline has no comparison, not even close.

As a result of this period of deep job losses, we will soon see the number of payroll decline move to a statistically insignificant level, < 100K per month, and mild payroll increases should arrive by mid-2010. (Notice, this is changed from the estimate that they’ll arrive by early-2010 that I mentioned in Friday’s letter based on the hours worked figure that can’t get off the mat, and even then the job additions look to be slight unless that hours worked number spikes). However, the unemployment rate, which usually takes only about 10-12 months to come down by 2-3 percentage points once it peaks, may remain very elevated for a long stretch this go around. As we touched on Friday, the Fed is at zero – as if I need to remind anyone. This means that the tightening campaign, which almost always induces recession and causes labor market weakness, will be substantially more aggressive than what is typical. We should not expect the normal Greenspan-era ¼ point increases, they will be more substantial. Further, this tightening campaign will accompany higher tax rates this time – a nasty economic brew. These are the unfortunate thoughts the investor must be aware of. Just as the stock-market cheers the fact that ZIRP lives, it will jeer when it’s euthanized (whether it’s on the Fed’s longer timeline, or is more abrupt as much higher interest rates will be necessary to rescue a drowning dollar). The average time period in which the Fed has begun hiking rates following a peak in the jobless rate is six months. One month is the shortest period of time and 22 months is the longest. We have not yet seen the unemployment rate peak, but even if this were it, one can be sure the Fed is going to wait longer than the average – unless forced to move by some other event. The longer they wait, the more abrupt the tightening campaign will be.
Consumer Credit

The Federal Reserve reported that consumer credit fell $14.8 billion, or 7.2% at an annual rate, in September. This marks the eighth month of decline and the longest streak since records began in 1943. Borrowing for both revolving (such as credit cards) and non-revolving (such as auto loans) continue to tumble due labor market conditions and high delinquency rates – that is, both the supply of and demand for loans is on the slide.

Not that we needed further evidence, but credit expansion will not be here during this expansion, an element of the economy that had been especially present over the past two economic recoveries –credit expansion aided in smoothing out personal consumption until job and income growth returned. One of the major problems right now is that the Fed’s extended easing campaign in the period 2002-2005 that kept rates too low for too long encouraged a debt burden that we now must work through – it will take a while to accomplish.

Revolving credit fell $9.93 billion in September, or 13.3% at an annual rate. Non-revolving credit declined $4.87 billion, or 3.7% at an annual rate.


An Auspicious and Horrible Century

Today’s date marks the 20th anniversary of the fall of the Berlin Wall -- the reunification of Germany. November 9 also marks the terrible, evil event of Kristallnacht – 71 years ago. We should never forget either occurrence, particularly the actions that brought them about.


Have a great day!


Brent Vondera, Senior Analyst